There’s power in the picture. There’s no denying it and I think most people assume this already. A visual has the potential to bring curiosity and often gives off a certain vibe that brings more questions or leads to someone to swipe to the next picture with disinterest. Instagram, Pinterest and Snapchat are just a few platforms that have hooked so many people with visuals. Many people won’t even read an article or blog post if there isn’t a picture included.
Visuals also show up in the classroom. If you have some time, I highly recommend taking a brief look at YouCubed’s article on visuals in the math classroom. They take the form of classroom posters that are on the walls. They’re also found in textbooks, on worksheets, on stickers, shirts, shoes, and so many other objects that people see all the time. I think they also have a role in the math classroom and many teachers and students have used them to make sense of the mathematics that they’re exploring. Visual models are often used to organize thoughts, make connections, and communicate understanding. Individual meaning is often associated (although not always) with visual models and educators get to see how how the decontextualizing <–> contextualizing process works with these types of models.
I believe visual models have an important role in math classrooms. Some students make meaningful connections by creating a map of their mathematical thinking. Often, these maps are related to what’s introduced in class, other times maybe not. Students might adopt certain visual models because that’s how they’re told to complete certain problems. I see this regularly when it comes to fraction models. The rectangle and pie area models are rampant. This sin’t a gripe, but just an observation as the visual model might be more emphasized depending on the teacher/grade level.
I believe there’s potential with using visual models, but they’re not always the default. Communicating and having the students bring their own awareness to when/why certain models are used is important. Rate/ratio tables and tape diagrams lend themselves well in having students organize their thoughts. When asked to create a visual model I sometimes hear students say that they’re visualizing it in their head and then they write down the solution on paper. Other times, students thoroughly create large models and use them to find solutions and add more than enough details.
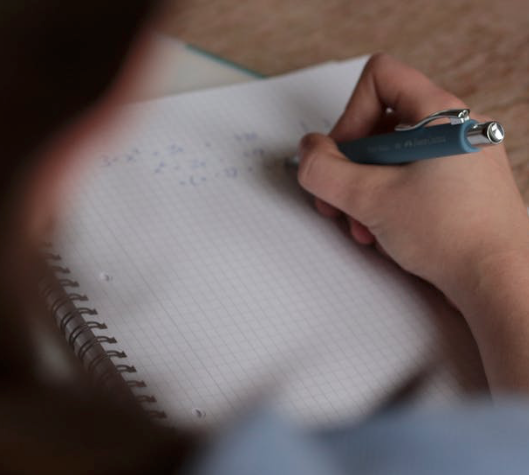
I’m looking forward to seeing how students approach this problem tomorrow.
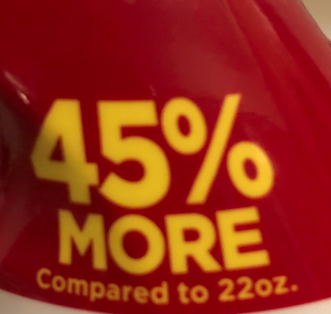
Students are familiar with finding 50% or 10% of a number, but this is different. I’m wondering if using a visual model will be part of their problem solving process?

Hello Matt,
I think you make a really good point when you described the “power in pictures” with Instagram, Pinterest and Snapchat. Much communicating is down through pictures in this generation and most likely the upcoming generations. Some people can learn by just listening but visuals are a important form of communication and making connection with content, especially in math. What lessons or units do you think will be more heavily reliant with visuals to help the students learn or do you think there’s should be visuals all around?
LikeLike
I believe most lessons or units have some type of visual component. I see them heavily used at the elementary level. Fractions, measurement, base-ten blocks and other concepts are often introduced with some type of concrete visual model. Unfortunately, some of the shine of using manipulative and visuals decreases as kids progress into and beyond middle school.
LikeLike