
One of the primary goals this year is to find opportunities to use rates in a more practical setting. This past week my classes started to explore rates in more detail. Students studied visual patterns and rules last week and this has led up to using/converting rates with formulas. While planning I dug out a rate activity that I used last year.
So on Monday I took masking tape and made a simple racetrack around the classroom. The track measured approximately 62 feet. Students took turns timing each other and documented how long it took them to quickly speed-walk around the track twice. We used an online stopwatch to time each student as they sped around the circuit.

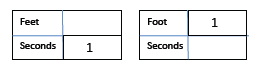
Students documented their time and started to fill out the sheet below. The sheet is an upgrade from last year and I feel like it addresses more skills.

Students were asked to convert their time into feet per second and then how many feet would be traveled in one second. After the feet per second conversion, students converted the seconds to minutes. I gave students an opportunity to find this conversion by exploring and then checking their work.
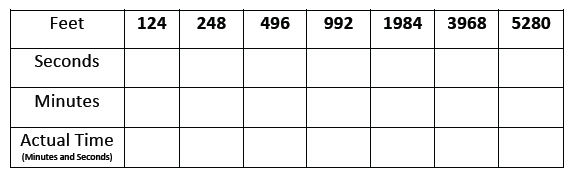
Similar to last year, this section was challenging for many. Understanding that 1.8 minutes isn’t 1:08 or 1:80 was addressed. I was proud to see students use perseverance to work through this section and use formulas to find solutions. The last section on the front asked students to find how long it would take for students to walk one mile at the 124 foot pace.
The most challenging part of this was converting the minutes and seconds to actual time. Once students understood the formula they became pros, or at least closer in understanding rates. Some even found how long it would take them to walk 5 and 10 miles. We shared the data as a class and found that our times per mile ranged from 9:45 – 16:00 per mile. Then students graphed the information on the backside. I actually thought of using a graph after reading through Fawn’s visual patterns template sheets.

Afterwards, the class had a conversation about all the different math skills that were utilized while completing this activity. We made a list that included conversions, formulas, graphing and many others. I’m hoping to reference this activity and concepts experienced throughout the year.
