Math Error Analysis

Screen Shot 2018-03-27 at 1.15.45 PM

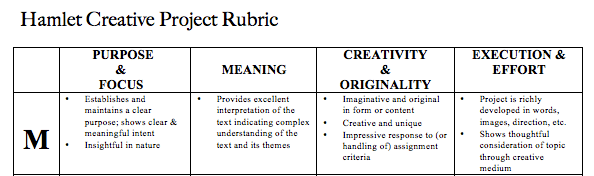
My third grade class finished up a cumulative assessment last week.  This particular assignment was completed independently and covered skills from January – March. The assignment spanned the last two units of study and reviewed topic of factors, multiples, composite/prime numbers, area, fractions, decimals, measurement conversions, using standard algorithms, and angles.  There was a hefty amount of content found in fairly large assignment.  It took around two classes to complete the task.

It’s my personal belief that an assessment should be worthwhile to the student and the teacher.  Why take the time to give the assessment in the first place??  Well …. don’t answer that – especially when state standardized testing is right around the corner.  : ) There are some assessments that teachers are required to give and others that are more optional.

My assessment for learning belief stems from past experiences that weren’t so thrilling.  I remember being given a graded test and then immediately moving on to the next topic of study.  There wasn’t a review of the test or even feedback.  A large letter grade (usually in a big red marker) was on the front and that was that. This left me salty.  All teachers were students at some point and this memory has stuck with me.

I like to have students review their results and take a deeper look into what they understand.  In reality the assessment should be formative and the experience is one stop along their math journey.  It should be a worthwhile event. It’s either a wasted opportunity or a time slot where students can analyze their results, use feedback, and make it more of a meaningful experience.

So back on track … These third graders took the cumulative assessment last week.  I graded them around mid-week and started to notice a few trends.  Certain problems were generally correct, while others were very troublesome for students.  Take a look at my chicken-scratch below.

Screen Shot 2018-03-27 at 1.03.36 PM

As you can tell, problems 2, 4, 8, 11 and 22 didn’t fare well.  It seemed that problems 3, 17, 18, and 21 didn’t have too many issues.  My first thought was that I might not have reviewed those concepts as much as I should have.  There are so many variables at play here that I can’t cut the poor performance on a particular question down to one reason. That doesn’t mean I can’t play detective though. My second thought revolved around the idea that directions might have been skimmed over or students weren’t quite sure what was being asked.  So, I took a closer look at the questions that were more problematic.  I looked in my highlighter stash and took out a yellow and pink.  I highlighted the problems that were more problematic pink.  Yellow was given to the problems that were more correct.

Screen Shot 2018-03-27 at 1.24.40 PM.png

The next day I was able to review the assessment results with the class.  I gave back the test to the students and reviewed my teacher copy with the pink and yellow with the class.  I used the document camera and made a pitstop each pink and yellow highlight and asked students what types of misconceptions could possibly exist when answering that particular question.  I was then able to offer feedback to the class.  For example, one of the directions asked students to record to multiplicative comparison statements. Many students created number models, but didn’t use statements.

Screen Shot 2018-03-27 at 1.01.36 PM.png

Students also mixed up factors and multiples

Screen Shot 2018-03-27 at 1.01.54 PM.png

Many students forgot to include 81 in the factor pair and thought they didn’t have to include it since it was in the directions.  Hmmmm…. not sure about that one.

Some of the problems required reteaching.  I thought that was  great opportunity to readdress a specific skill, but I could tell that it was more than just a silly mistake.  I think the default for students is to say that 1.) they were rushing or 2.) it was a silly mistake.  Sometimes it’s neither.  I had a mini lesson on measurement conversions.

Screen Shot 2018-03-27 at 1.02.03 PM.png

I also reviewed how to use the standard algorithm to add and subtract larger numbers.  Some students had trouble lining up the numbers or forgot to regroup as needed.

Screen Shot 2018-03-27 at 1.02.12 PM.png

I offered up some graph paper to students that needed to keep their work organized.

After the review, which took about 10-15 minutes, I gave students a second opportunity to retake the problems that were incorrect the first time around.  I ended up grading the second attempts and was excited as students made a decent amount of progress.  The majority of pink highlighted problems from earlier were correct on the second attempt.  #Eduwin! The feedback and error analysis time seemed to help clarify the directions and ended up being a valuable use of time.  I’m considering using sometime similar for the next cumulative assessment, which will most likely occur around May.

Now, I don’t use this method for all of assessments.  My third grade class has eight unit assessments a year.  After each assessment I tend to have students analyze their test performance in relation to the math standard that’s expected.  Students reflect and observe which particular math skills need bolstering and set goals based on those results.  There’s a progress monitoring piece involved as students refer back to these goals during there next unit.


Side note: I had trouble finding a title for this post.  I was debating between misconception analysis and assessment analysis.  Both seemed decent, but didn’t really reflect the post.  So I tried something different – I wrote the post and then created the title.  I feel like error analysis fits a bit more as the errors that were made weren’t necessarily misconceptions.  Also, this post has me thinking of problematic test questions.  That could be an entirely different post.


Reading Menu Projects

This year I’ve had the opportunity to work with a fifth grade reading group. My day consists of almost all math instruction, so having a reading enrichment group is something different. I appreciate the different subject matter as I tend to look at most content through a math lens. The group meets every day for about 30 minutes. This is my third year teaching this  group and I’ve become more familiar with the resources every year.

I find that each year brings new ideas and this year is no different. I always tend to ask question about making relevant connections to the content that I teach. This year my students are studying Hamlet. They’re not delving too deep into the original text. In fact, we’re reading this book and have been exploring Hamlet for the past month. It’s been an exciting journey. Along with reviewing the play, the class used a character map, learned about Will, and viewed clips from a contemporary portrayal of Hamlet with David Tennant.

The class is now in the final stretch of our Hamlet unit. So, for the last unit I decided to try something different. Ideally, I’d like to have students remember Hamlet when they encounter it again in a few years. I decided to use a menu board approach.  Each student picked one project below.

Screen Shot 2018-03-19 at 7.42.49 PM.png

The class then reviewed a criteria for success rubric. Honestly, the rubric seems quite intense at first. But in all fairness, I needed to have a rubric that actually encompassed all of the menu items.

Screen Shot 2018-03-19 at 8.10.59 PM.png


I made sure to have the students review the part on the left side. In that past, I’ve found that sometimes students might pick a project that is less challenging. I was hoping to be proven wrong with this project.


Screen Shot 2018-03-19 at 7.30.30 PM.png

Students “signed-off” on the project and were committed.  I find value in having students actual write that they agree to the criteria.  I think it adds an ownership element that isn’t always there.  It also reminds me what resources to pick up before next class.

Screen Shot 2018-03-19 at 8.10.23 PM

I was pleasantly surprised to see that all of the menu items were picked – some more than others.

Screen Shot 2018-03-19 at 7.47.33 PM

Students were then given the remainder of that Monday to work on the projects. Near the end of class I told the students the plan for the rest of the week.  They had the next four days to complete their menu item. My job was to gather materials and the technology that was needed. I had to find more technology since my school isn’t 1:1. I begged and borrowed from the other teachers in my building to get enough Chromebooks and iPads to make the projects feasible. Priority for iPad and Chromebook use was given to the stop-motion-video and board game creators. I was pleasantly surprised to find that some of my kids wanted to create a video game using Scratch.  One of my favorites was a duel between Hamlet and Laertes, where Hamlet always wins.

This slideshow requires JavaScript.

Near the end of the week most students were finished, although a few voluntarily came in during their recess to finish up the project. The next Monday was designed for feedback.

Over the weekend I created a Google Form for student feedback. Students scanned the code when they entered the class.  Each student filled out the feedback form and reviewed another student’s project.

Screen Shot 2018-03-19 at 7.49.03 PMScreen Shot 2018-03-19 at 7.49.12 PM

You can view the sheet here. Currently, the class is halfway through giving feedback because we’ve had a slight interruption because of Parcc testing. Tomorrow the class will be giving additional feedback. My plan is to print out the feedback and give the responses (without the names) to each student. The authors will then have an opportunity to analyze the feedback and give responses as needed.

The student engagement for this project was top notch and I was impressed with the quality of work produced.  This reading menu has me wondering how a menu system could be applied in the math classroom.  So far, I haven’t had as much success with a menu in the math classroom.  I’ve used choice boards, but they haven’ been anything spectacular. Anyone have success with this?  This topic is something to ponder before heading off into spring break next week.

Fraction Division – Models and Strategies

My fourth grade students have been exploring fractions.  They’ve become familiar with how to add, subtract, and multiply fractions.  They just started to divide fractions earlier in the week.  Whenever I introduce fraction division I tend to have one or two kids that raise their hand quickly.   Their quickly raised hand tends to cause me to slow down and prepare.   They comment that there’s a “fast” way to divide fractions that they learned at Kumon or from someone at home.  Sadly, that trick is infamous number 1 on the NCTM’s Tricks that Expire!  These students can explain what to do, (change the numerator and denominator of the second fraction and multiply) but struggle when pushed to explain why it works.  I feel like at times these particular students inadvertently or purposefly convince others in the class that this method is the quickest.  Some agreed, but introducing this idea at the begging caused unneeded confusion.

I shifted the discussion to the meaning of the fraction bar.  One of the students mentioned that the fraction 1/2 is the same as 1 divided by 2.  Another student said that is the same as 0.5.  This conversation was productive and moved the discussion back on course.  Students started to build upon each response and were able to start thinking more about their own understanding of fractions.  I then introduced the idea of fraction as division.  This resonated well with students and I could tell that they were really thinking about how they view fractions.  I then put this problem on the board.

Screen Shot 2018-03-14 at 8.25.39 PM

Students thought for a little while and then decided to split up each fraction into three pieces.  They then counted up the pieces to find 9.

Screen Shot 2018-03-14 at 8.29.06 PM


I then introduced students to a common numerator and denominator model.  Students thought about this problem and then started making a few guesses.

Screen Shot 2018-03-14 at 8.31.45 PM.png

One thing that seemed to shift this thinking was to look at fraction as division.  In my years of teaching this seems to make quite a few connections   Many students know that a half of a half is a quarter, but are a confused when it comes to dividing a half.  One student mentioned that they both have common denominators and that might be useful when dividing.  Another student said that a fraction is division, so you could divide the numerators and denominators.

Screen Shot 2018-03-14 at 8.34.07 PM.png

The class agreed that this will work as long as the denominators are the same. They also concluded that if the denominators aren’t the same, we can find an equivalent fraction to create ones that are. This conversation lasted for about five minutes.  It was productive and not once was there mention of a “fast” method to divide fractions.  I’m hoping that students hold on to visual models and using a variety of strategies when dividing fractions in the future.  Next week, we’ll be investigating how to divide mixed numbers.  That’ll most likely happen after our week long PARCC adventure.

Representing Volume

Screen Shot 2018-03-05 at 6.10.49 PM
My fourth graders are starting a new unit on fraction computation this week.  Last week, students finished up month long unit on volume and area.  After grading the tests, I started to reflect on a few different activities that seemed to help students understand volume a bit better.  One particular task will be highlighted in this post. I’m not going to lie, this task was quite challenging for kids, but I feel like the students were able to make some amazing math connections in the process.

So last week, I brought the students to the front of the room and we discussed area and volume.  Students provided examples of area and volume and referenced the city that they created earlier in the year.  Students then randomly came up to the room and drew out a slip of a paper.  The slips indicated a particular volume task. The tasks were all related to making a 3D shape that matched a certain dimension range.

Screen Shot 2018-03-05 at 5.53.15 PM

Screen Shot 2018-03-05 at 5.53.09 PMScreen Shot 2018-03-05 at 5.53.03 PM

Students drew the small little sheets out of a cup.  It was exciting as students weren’t quite sure which sheet they were going to get.  Students were then given the direction sheet, where they were asked to create the net, tape/glue it together, place it on the sheet, and then take a picture and send it to their digital portfolio.

Screen Shot 2018-03-05 at 6.06.56 PM.png

Students were then given the centimeter grid and were off to the races.  Some students had to take multiple grid sheets as they missed the required dimensions on many different attempts.  Eventually, most students calculate the volume that they needed and used a formula.  Students then used the formula to calculate the volume before creating the net.

Screen Shot 2018-03-05 at 6.01.41 PM.png
This took multiple attempts

Students didn’t seem to have too many problems with rectangular prisms or cubes, but cylinders and cones were a bit more challenging.  Students were able to create the base fairly quickly.  The curved surface was an issue for some.  Many students had trouble creating a large enough curved surface to match the cones and cylinders.  One student mentioned that the curved surface needed to be around 3 1/4 of the length of the circumference.  I enjoyed hearing that as a couple students had a conversation on how to make their shape fit a required dimension. That’s an #eduwin in my book.  Students then attached their constructed structures to the direction sheet.

Students then put the different structures on a map and created a small city.  I’m hoping at some point the students will be able to create a short stop-motion-video using the volume structures.  It might fit in perfectly with our rate/ratio unit that will be coming up after PARCC testing.

Screen Shot 2018-03-05 at 6.08.17 PM