School officially ended on Monday. It didn’t feel like a typical end of the school year as teachers said goodbye via Zoom and then shut off their computers for a little while. It’s now time to reflect, drink my coffee slowly, work on a few house projects and take some time for self care.
Before leaving for the summer I asked students to fill out a Desmos survey that I found online. It was originally created by Rachael Degnan and I edited it to reflect my students’ situation. The survey asked students about eLearning, their effort and a number of other questions related to this school year. I was able to get 44 responses in total. I’ll post the slide question and observations in the captions.
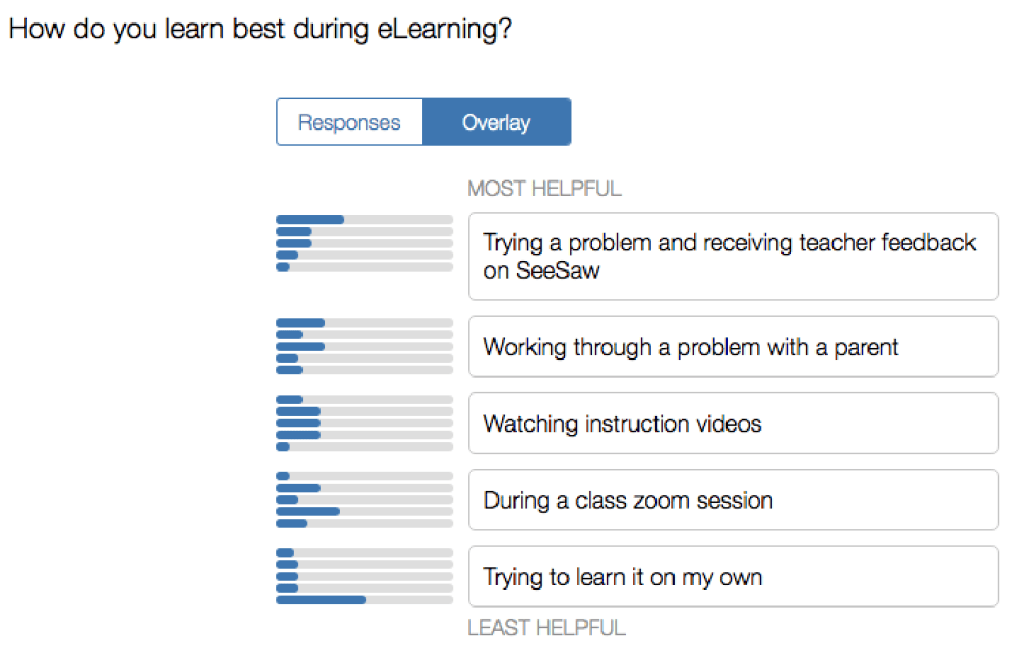
The first question asked students about elearning and instruction. In my case students primarily use the SeeSaw platform. Teachers were expected to post daily assignments in SeeSaw for students to complete. The assignments were posted by 9 am and Zoom sessions were scheduled throughout the week – some by the homeroom teacher and others by specialists. Sometimes the Zoom session related to the daily assignments other times that wasn’t the case. It was up to the teacher to decide what to assign and how to use the time during the Zoom sessions.
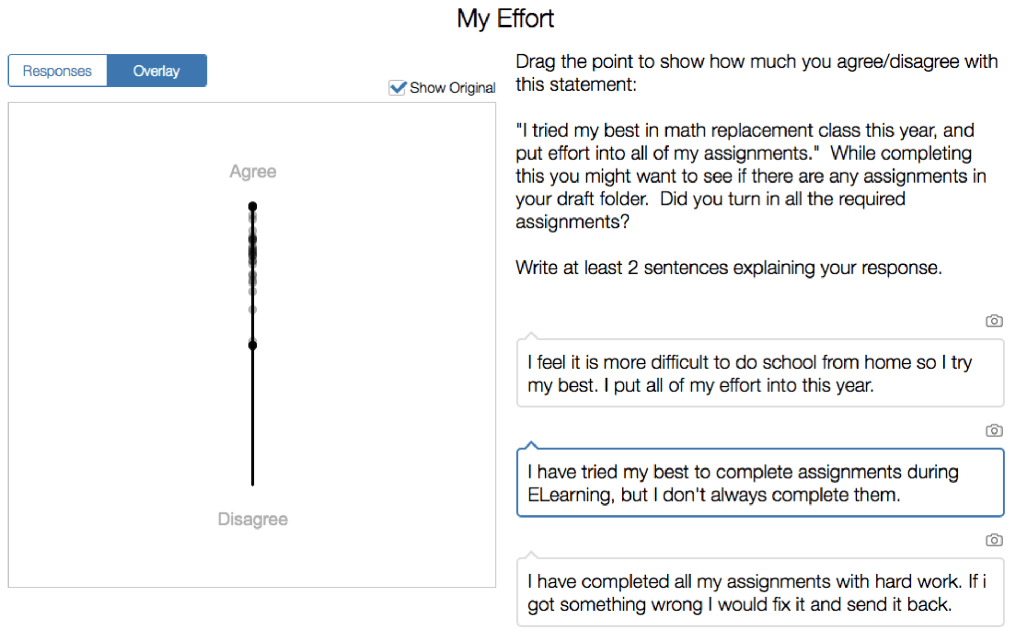
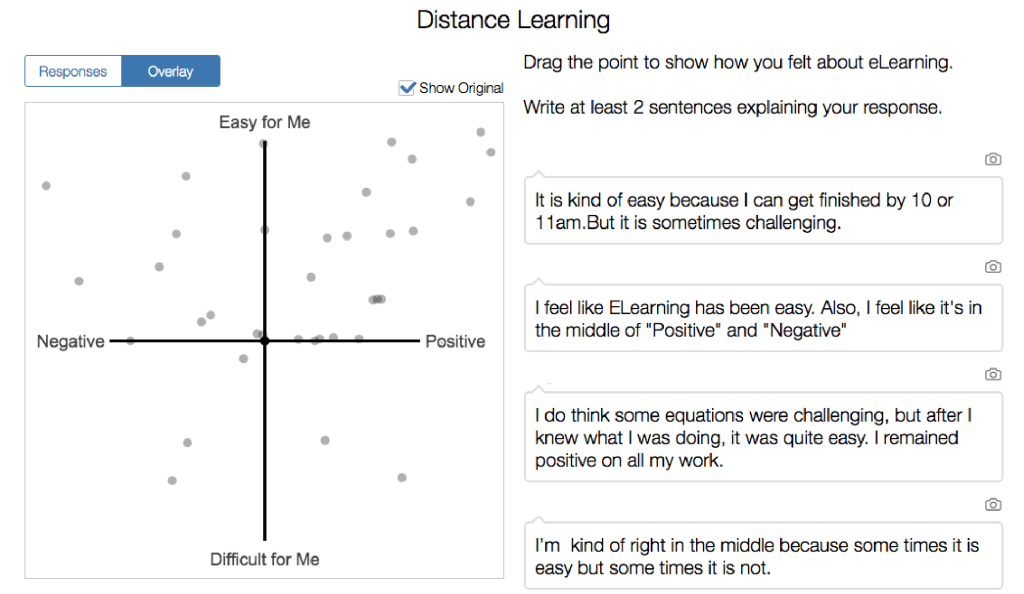
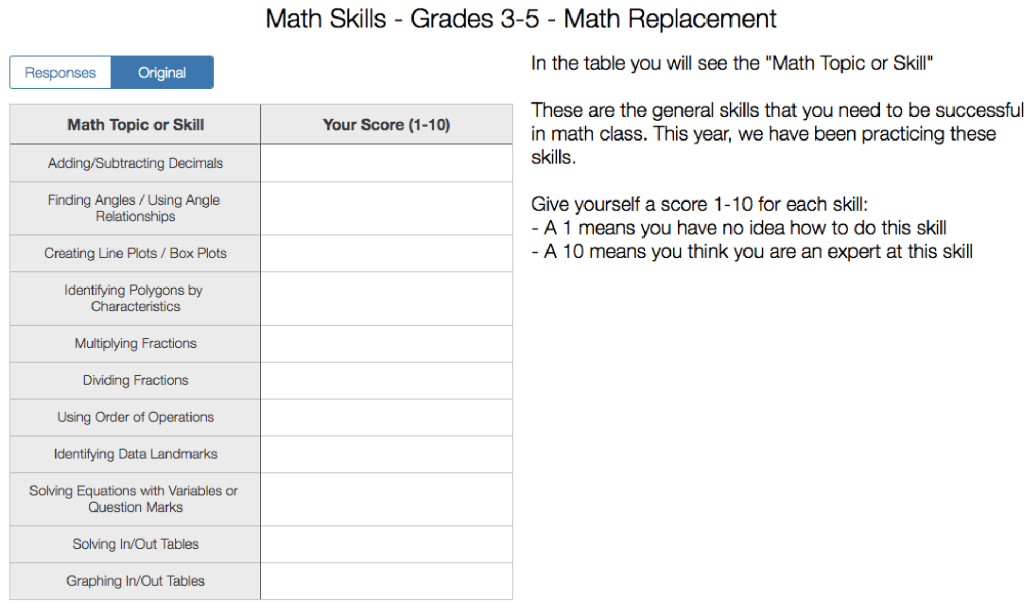
Most teacher assignments included some type of instruction (possibly pre-closure) or during a Zoom session/teacher instruction video. The most helpful, according to the students was trying a problem and then getting sometime of feedback from the teacher. I’d say approximately 60-70% of the assignments required a student to review the teacher feedback and make a second attempt. Some students required additional attempts. If students were still having difficulty after multiple attempts the teacher would sometimes create a brief instruction video or screencast to help.The second question related to effort. Most students felt as though they tended to put in a good amount of effort during class. I think if I excluded it to just eLearning the results might be slightly skewed lower. Some students mentioned in the comments that they didn’t try as hard during eLearning because there wasn’t as much work expected. That’s true because the work required decreased during emergency eLearning.Students tended to skew more positive on the improvement as a student/learner compared to the personal level. This was given to students in grades 3-5 so that’s also something to keep in mind when analyzing the results. Many students related to personal growth to making new friend and helping others in need. I saw responses like this in the student explanations. I thought that was interesting as it wasn’t something that the class discussed much in detail. This question had responses across the entire grid. Students generally completed the math work in the morning after a homeroom class Zoom session. If a students was having trouble with a concept it was challenging to address it without seeing the student work first. I think this was tough for some students as they were able to ask for help from a parent and others were not. Some students mentioned in the comments that they couldn’t work through problems with a partner or group and that negatively impacted how they felt about eLearning. Other students were nervous and weren’t quite sure how to work their question so they gave up or left question fields blank.A couple things stood out to me with this question. Most of the students liked completing tasks at their own pace. This doesn’t happen as much as I’d like it to in the regular classroom as schedules often limit timing. Many students mentioned they learn best in-person. This isn’t surprising and highlights the importance of being able to see a student, their work, non-verbals and use those to connect and give feedback. I believe students missed those connections. The top vote was “getting good grades” and part of me feels sad about this. I try to devalue points/grades as much as possible and focus on the math journey instead. There’s quite a bit of pressure for these students to do well. I was glad to see maintaining friendships and building new friendships to be in the upper half of the priority list. I loop with most of my students so it’ll be interesting to see how students react when I show them this data in the fall.Each student filled this out and I was pleasantly surprised with the results. Most students gave themselves between 5-10. Concepts that haven’t been discussed as much were in the 5 range. Again, I’ll be reviewing this with the students that I loop with in the fall.
I was initially teetering on whether to give this feedback survey. I’m glad I decided to try it out and will be parsing out more details as I dig into the data a bit more over the summer.
I've taught elementary and middle school students for the past 20 years. I enjoy reading educational research and learning from my PLN. Words on this blog are my own.
View all posts by Matt Coaty