It’s hard to believe that my school year is about 25% complete. Ask any teacher and they’ll probably say that number isn’t correct. It certainly doesn’t feel like it right now. Report cards are right around the corner followed by Zoom conferences. While thinking about conferences earlier this week I started to brainstorm a few ideas of how to help briefly communicate how students are feeling about math in relation to their achievement. I’ve used student reflections and goal setting for that in the past with moderate success. Google Form reflections have been used to showcase students’ perceptions of their understanding of certain math concepts. The data I received was useful but organizing it into a presentable format wasn’t ideal. Also, time is certainly important this year as I’m not seeing kids as much this school year and I needed a different way to collect the data. This year I decided to switch my strategy after reading @mathycathy ‘s tweet.
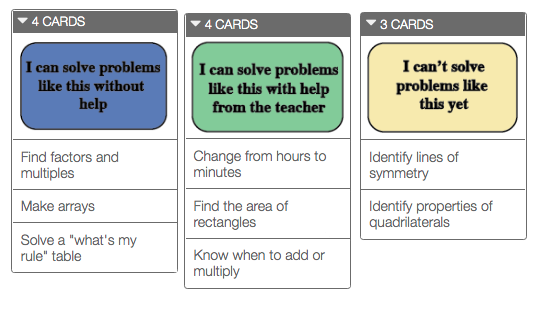
I took the idea and changed the three categories for my 3rd-5th grade students. I then took the skills associated with the test and wrote them out as a text cards. Groups of problems were categorized with certain skills. Students reviewed their digital test and dragged the cards to a category.

Students then reflected one last time to make sure each skill fit a particular category. I think most questions came from students wondering if the blue or green categories applied. There wasn’t much of a question for those in the “I can’t solve problems yet” category. Students then completed the last slide.
I’m planning on using this during parent conferences this year over Zoom. Student perceptions are important and being able to communicate where students think they are compared to the expectation is an important piece. At some point I’d like to have students use goal setting after reviewing their assessments. I’m looking forward to seeing how this pans out with my other classes throughout the year.
