Student feedback and goal setting have been different this school year. The students that I teach have been learning from home and in the classroom. The district has moved back and forth between remote and hybrid models since August. Students have recently been back in the classroom and and it’s not possible to use shared paper materials. This has been one of the most challenging problems this year. Therefore I’ve needed to rely on digital means for instruction and manipulatives. This has impacted how students receive feedback and set goals.
I’ve been using Desmos more than ever since my lessons are digital. It has pushed me to find ways to use the platform so students think more critically about math. Through the process I’ve learned more about how to create better tasks that enable students to reflect on their math work. I’ve found so much support from the Twitter Desmos community. I’ve slowly been learning more about Desmos CL and how to incorporate it into my decks so students are able to process the concepts they discover and receive feedback. I started using CL more frequently after reading Julie’s fantastic post. For the past month or so I’ve been working on creating self-checking tasks with small wins here and there. Last week I found a recipe that has been somewhat successful for formative checkpoints. I used it with a few different classrooms last week with multiple choice questions.
Here’s how it goes. Students synchronously complete a list of multiple choice questions related to a specific skill. I added the sketch pad for students to show their work and used teacher pacing to make sure students only have access to the question slides.
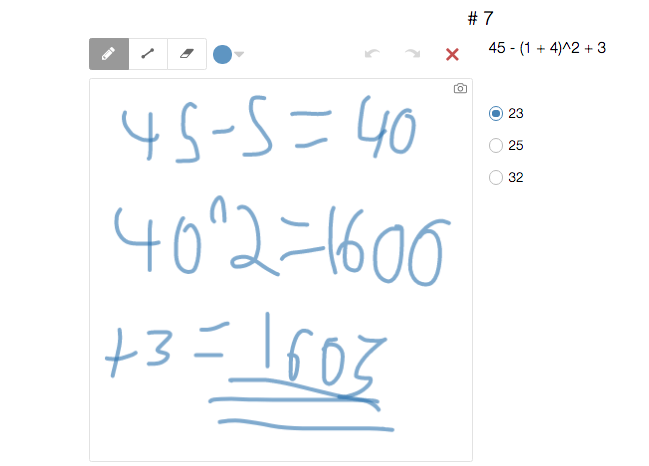
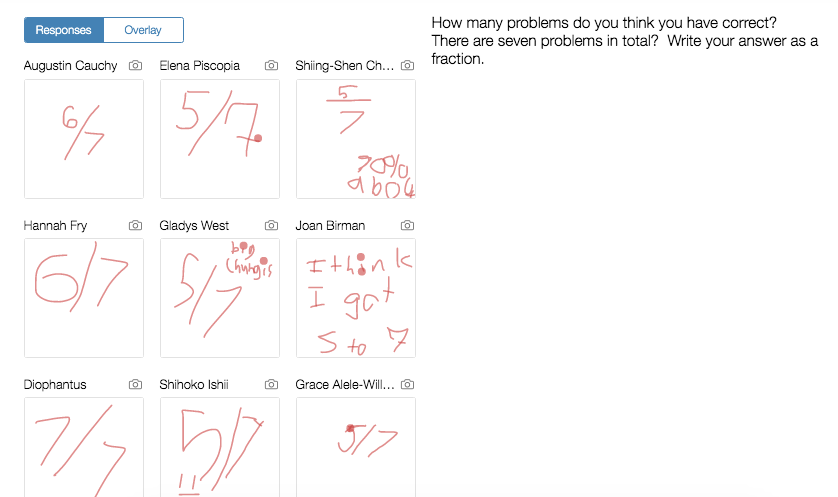
Once students finish the questions they visit a slide where they’re asked to reflect on the questions. They also draw on the sketch pad how they think they performed. During this time students revisit the questions in order to make an accurate prediction.
Then the final slide opens indicating correct/incorrect answers. The prior slide is copied over and students reflect on their performance compared to the estimate.

The student responses comparing their results to the prediction were stellar. Afterwards, the class had a conversation about the questions that were more challenging than others and why those stood out. I’m hoping to expand on this idea in January.
Feel free to use/copy/change the activity. It can be found here.