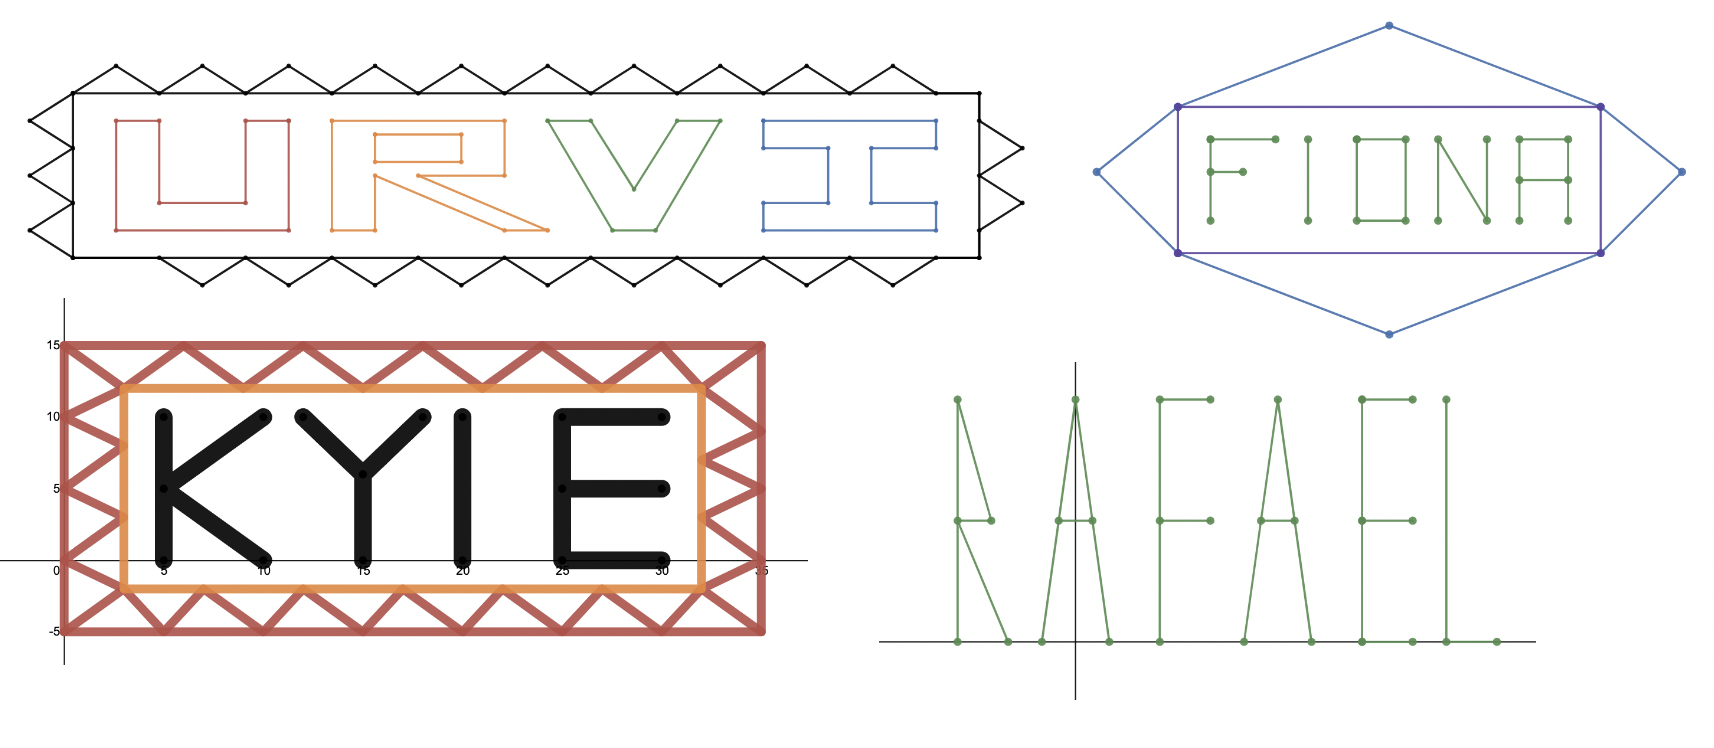
It is official. The 21-22 school year is in the books. It was a year like no other as teachers navigated remote, hybrid and in-person learning throughout the school year. One of the last projects of the year involved a first name coordinate grid task. During the last week of school my class explored coordinate grids and plotting points. Students found the midpoints of lines and solved problems involving scale models on coordinate grids. I thought this task might be a way to help reinforce coordinate points and quadrants. In addition, it was great to have students encounter math in a unique way. Kudos goes to Cathy for sharing the deck which helps guide students through a learning process of graphing points on a grid.
The instructions were key for students as they built confidence before starting the final project. Some students decided to use scratch paper and create their name there first as a draft. Other students dove right in and started the creation process. Students were given about 30 minutes to work on the project and they were asked to submit it to Canvas once finished. About half of the class finished within that time. During the next class the projects were shared and students explained how they made the different shapes and borders using tables.
I was impressed with the time many of the students put in to make this project a reality. During the last day of school I handed each student their printed out copy of the project. I am hoping they brought it home and it is something that brings back a positive math experience memory. Looking forward, I am planning on doing this math and art combination activity next school year.
This week one of my classes has been studying coordinate grids and graphing. They’ve learned about coordinates, using a table, identifying rules and created ordered pairs during the last part of March. On Monday the class reviewed line graphs and change over time. At this point in time the class is identifying the informal slope (without a formulas) of a graph and describe events that are taking place by analyzing the relationship between the x and y-axis. Earlier this week my students worked through Kurt’s Retro Desmos solving systems by graphing task.
I selected specific slides to complete as the class hasn’t been introduced to the y-intercept yet. The class spent a good chunk of time on slide four – a class favorite. Students tried out different strategies to see what happens as the lines cross or increase in steepness. This led to a class discussion about the slope of the line and what the x and y-axis means in context. A number of students experimented with what happens when you make multiple lines on the graph. This slide caused students to think about the context first and then how the lines look second. Near the end of the class students mentioned that they’d be interested in the process of finding the rate or speed of each character as time progresses.
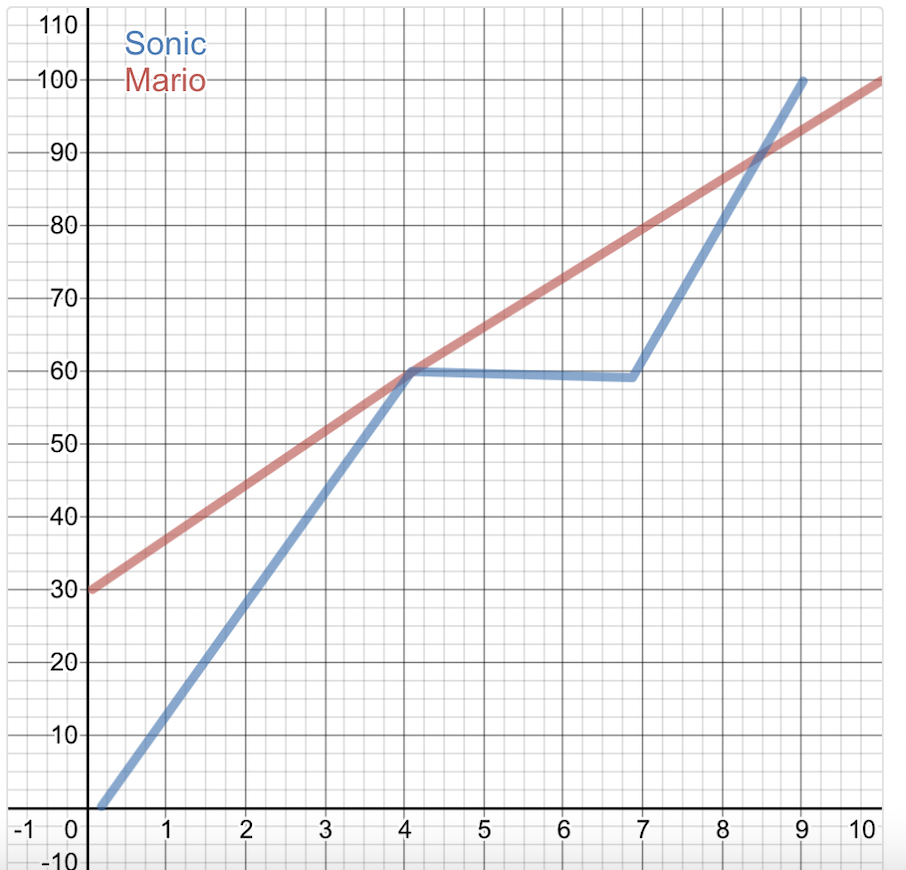
During the next class I used Kurt’s slides and idea to create an assignment. I added a few criteria pieces related to the 100 meter dash. Some of ideas were taken straight out of the original activity. Click here for the Desmos assignment slide.
Criteria: Mario starts 30 meters ahead, Sonic and Mario are tied at 4 seconds, Sonic takes a 3 second break, and Sonic wins at 9 seconds.
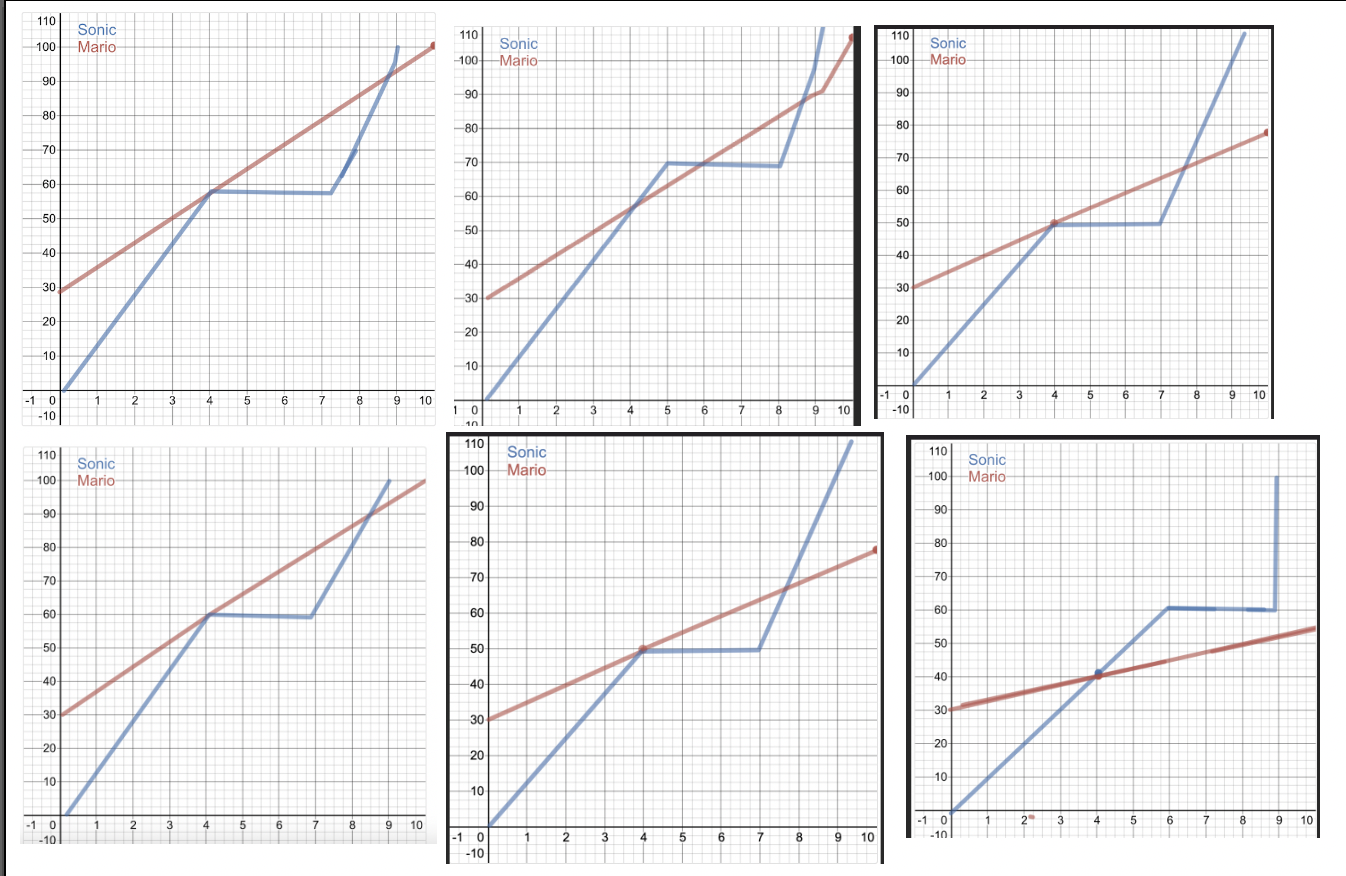
Students worked on this assignment in class and checked their work by pressing play. I was impressed with how students made multiple attempts in trying to meet the criteria. The video playback of the race was used as a self-checking mechanism.
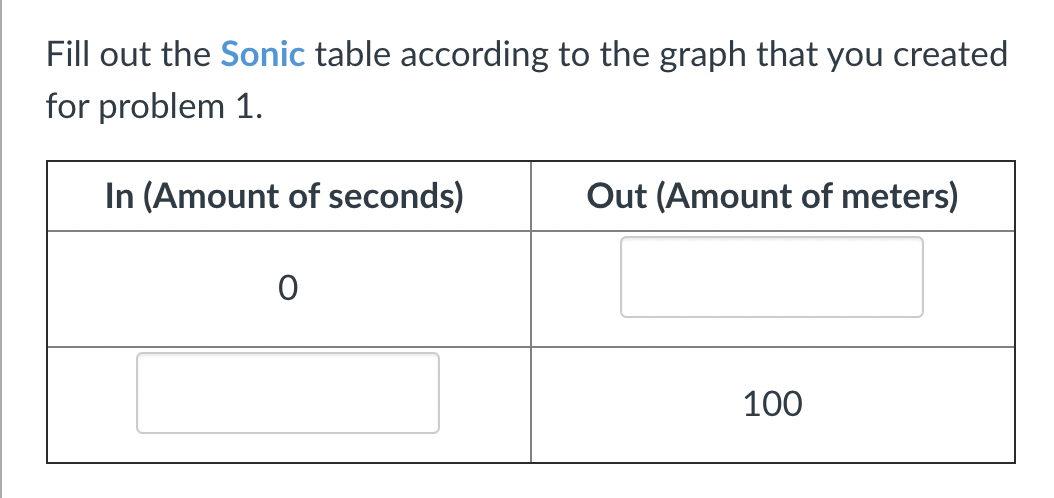
Students then answered a question related to Sonic’s line.
Tomorrow the class will review the graphs in more detail. I’m looking forward to diving into more graphing fun tomorrow.
This school year has been a bumpy ride. Many teachers have been asked to teach students in-person and online at the same time. Along with the hybrid model, time with students has been limited, which can cause retrieval issues. I’ve noticed that students need more retrieval opportunities with more feedback this year compared to years past. More check-ins and reviewing has been necessary. Out of necessity comes a different approach. For the last couple months I’ve been using a digital math review practice at the beginning of each week. I’ve been finding different ways to use Desmos to help students think about their own mathematical thinking. I have created a few original decks in the process, but have had the most success with copy –> edit with other decks. There are so many brilliant Desmos users (I’m looking at you RCS Desmos Team!) that’ve already put together amazing decks with CL self-checking abilities.
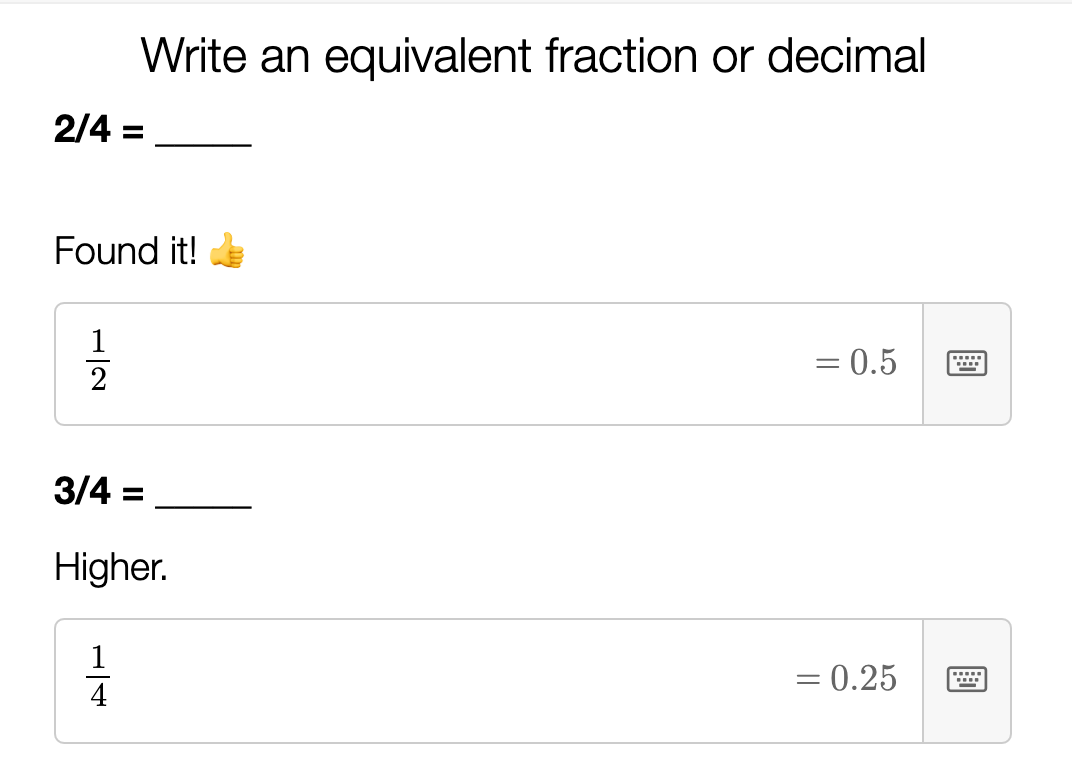
The Desmos activity in this post was primarily used to review math concepts. My rookie level CL skills gives the students a higher, lower, or just right designation. The small written feedback has been helpful so far. The deck begins by reviewing math concepts explored during the unit.
The next slides offer students an opportunity to review the results and go back to change them.
Students take around 5-10 minutes to complete the task. From the teacher dashboard I can tell how each student is doing and if additional review is necessary. I’m hoping as I learn more CL that I can make these types of practices better. Feel free to use the activity by clicking here. I’m looking forward to seeing what you create!
Student feedback and goal setting have been different this school year. The students that I teach have been learning from home and in the classroom. The district has moved back and forth between remote and hybrid models since August. Students have recently been back in the classroom and and it’s not possible to use shared paper materials. This has been one of the most challenging problems this year. Therefore I’ve needed to rely on digital means for instruction and manipulatives. This has impacted how students receive feedback and set goals.
I’ve been using Desmos more than ever since my lessons are digital. It has pushed me to find ways to use the platform so students think more critically about math. Through the process I’ve learned more about how to create better tasks that enable students to reflect on their math work. I’ve found so much support from the Twitter Desmos community. I’ve slowly been learning more about Desmos CL and how to incorporate it into my decks so students are able to process the concepts they discover and receive feedback. I started using CL more frequently after reading Julie’s fantastic post. For the past month or so I’ve been working on creating self-checking tasks with small wins here and there. Last week I found a recipe that has been somewhat successful for formative checkpoints. I used it with a few different classrooms last week with multiple choice questions.
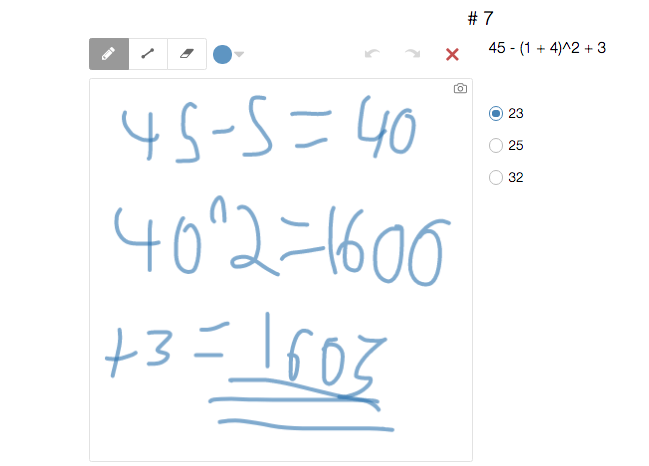
Here’s how it goes. Students synchronously complete a list of multiple choice questions related to a specific skill. I added the sketch pad for students to show their work and used teacher pacing to make sure students only have access to the question slides.
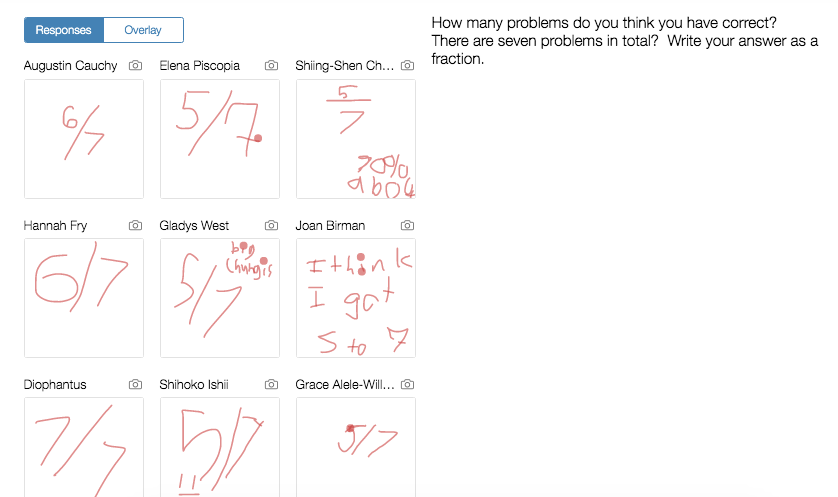
Once students finish the questions they visit a slide where they’re asked to reflect on the questions. They also draw on the sketch pad how they think they performed. During this time students revisit the questions in order to make an accurate prediction.
Then the final slide opens indicating correct/incorrect answers. The prior slide is copied over and students reflect on their performance compared to the estimate.
The student responses comparing their results to the prediction were stellar. Afterwards, the class had a conversation about the questions that were more challenging than others and why those stood out. I’m hoping to expand on this idea in January.
Feel free to use/copy/change the activity. It can be found here.
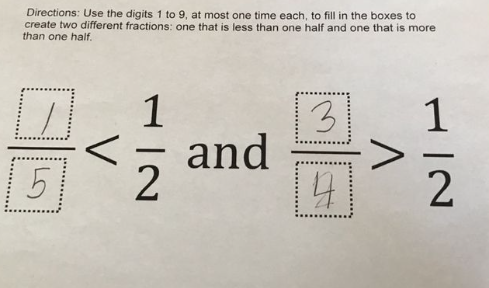
My third grade students started a new unit on fractions last week. They started the unit by learning about part-to-whole fractions and how to identify them. Student teams explored how fractions are represented in different situations. One of the first activities asked students to create their own version of a part-to-whole model. The scissors came out early this week while students cut out fraction area models.
They compared the pieces within the area models to create equivalent fractions. This gave students another way to compare and observe equivalencies. This was time consuming activity, but so worth the time. Students made connections and played around with the circles/pieces to compare the models. The only negative was that some students didn’t cut the fractions exactly on the line so the pieces didn’t always line up. The next day students compared the fraction pieces using <, >, or = signs.
Students were making progress in comparing fraction area models. The fraction circles were being used consistently and then the class moved to transitioning to identifying and placing fractions on number lines. This was a challenge. We started with a 0-1 line and then identified half. From there students used benchmarks to compare fractions on line. Students had some trouble when the number line was stretched from 0-2. The class also explored how the fractions look on a vertical number line. A different dynamic was at play there. Students then practiced a bit more with an Open Middle activity.
Students were given opportunities to discuss fractions with their peers through a few different fraction math talks earlier in the week. The time spent today revolved around reviewing different fraction models. On Friday, the class participated in a fraction Desmos Polygraph activity. Feel free to use the program here. This was one of the learning highlights of the week. Students were asked to pick one of the fraction models that they created early in the week, while other students asked questions to help determine the fraction.
At first students asked questions related to the color of the fraction. Then they moved to questions involving less than half and more than half. Students found that clear questions revealed better answers.
I was excited to see that students were using benchmarks and part-to-whole ideas to help uncover the mystery pick. Students spent around 20-30 minutes exploring the polygraph with a few different partners. I even snuck in as a participant. I’ll be keeping this idea in my back pocket for next year’s plans.
Next week, students will start to add and subtraction fractions. I’m looking forward to seeing how students will use the experiences this week. There’s plenty more to this unit and we’re just getting started.
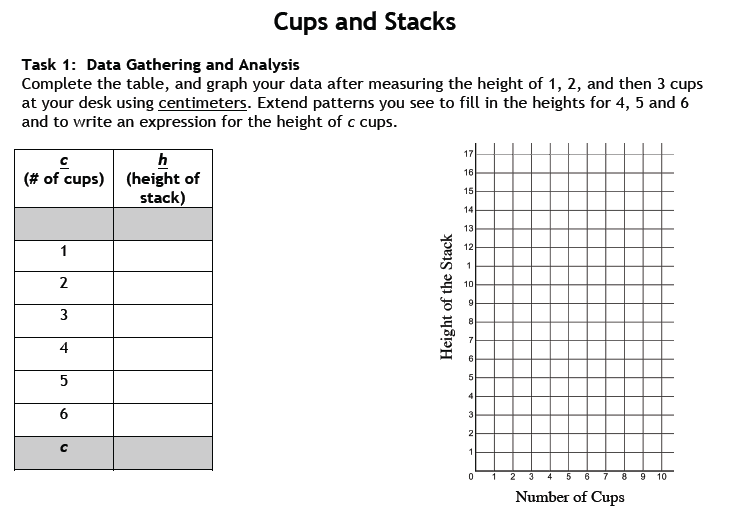
During the past few months I’ve had a chance to explore Desmos. I started seeing the platform on Twitter a while back through different educational chats. It was prevalent in #msmathchat as well as in the EduTwitter math world. I saw it across my screen, but didn’t really dig into how it could be used until NCTM. During that time I attended a session titled “Which Comes First: The Equation or the Functions? Come Stack Cups and Use Demos to Find Out!” The session was presented by the University of California staff.
The session started out by having the participants sit in groups with a stack of styrofoam cups. We were asked the question below.
My table took the cups and started stacking them. They found the measurement of one of the cups and decided to use millimeters to be more accurate. We came to a consensus and decided to extend the pattern and graph our pattern. The presenters then asked us to head to a Desmos url where we could plug in our numbers. The audience filled out this step-by-step sheet for the next 20-30 minutes. Being a newbie to Desmos, I appreciated how the sheet guided us through the different components of Desmos and how it graphs the line as the numbers change. The sheet also includes teacher directions that I found useful as I replicated this exact lesson a couple weeks after NCTM.
The second part of the session went in a different direction.
Basically, we were asked to find out the option that would give us the most money during the next 14 months. My table filled out this sheet and used this Desmos template to find a solution. There was a lot of trial-and-error during this time and some perseverance, but it was a worthwhile journey. Listening to others at my table was enlightening. Hearing how other teachers, mostly at the middle and high school levels, gave me a different perspective. Being able to find patterns and develop algebraic reasoning was at the forefront. Using Desmos to create or check our predictions was helpful. Moreover, I was able to learn more about the Desmos platform and how it could be used in my classroom.
Near the end of the session I started gathering all the links to save for later. I started to think about how this could be used in my own classroom. I began by using a few different tasks with my sixth grade standards. The inequality activities were very helpful as I was becoming more familiar with the logistics of using Desmos in the classroom. Desmos isn’t a math tool that’s used frequently in elementary schools. The calculator included can be intimidating for elementary students as well the teachers. Although, when my class first started using the platform my students were totally interested in wondering what all the symbols meant on the calculator.
During NCTM I was fortunate enough to come across Annie’s post on how to use Desmos in the elementary classroom. I reviewed all of Annie’s examples and decided to graduate and move on to creating my own. I started with copying a couple card sorts for a kindergarten and first grade group that I see four times a week. The sort included having students put together base-ten blocks, written names, standard form, and expanded form statements. The lesson went well and I had to intensely model how to login and ended up using a QR code for students to access the url on an iPad.
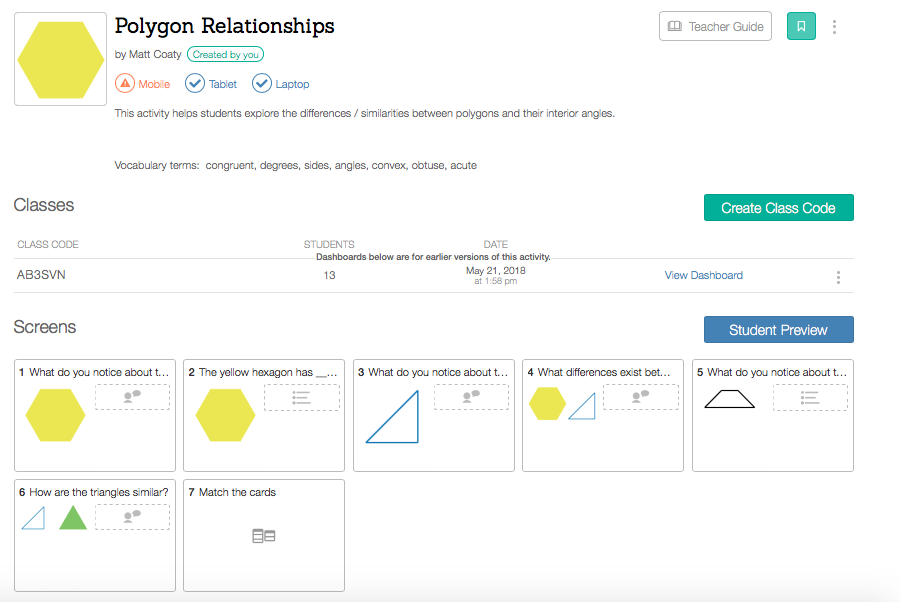
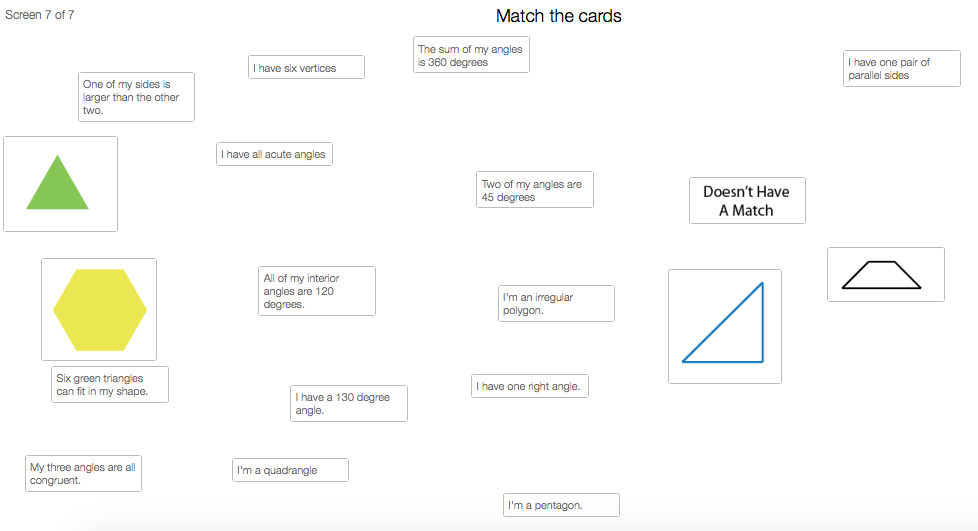
I then started getting used to how to create better questions using “what do you notice” or “what do you wonder” types of prompts. About three weeks ago my third grade students needed to review polygons and relationships. I decided to put together an original activity.
I ended up making the shapes in Illustrator and inserted them into the activity. I used this task with a third grade group of students that were working on fourth grade standards. Students worked in pairs as I didn’t have enough Chromebooks and iPads for everyone that day. I used the pacing function and made sure all the students were on the first slide. I love that Desmos includes that function as many of my students want to speed through an activity. Stopping with “pause” to review all the different responses was also helpful. This helped encourage a class discussion.
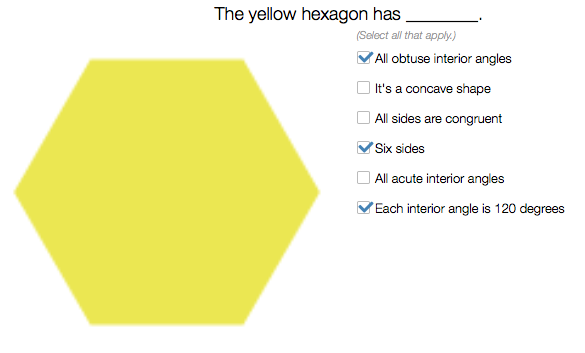
At first I used the “anonymize” option, but soon found that students wanted to be identified. Students used a similar prompt with a trapezoid and triangle. I then went over a few different vocabulary terms before heading to the next slide.
Students checked off the criteria that matched the shape. I then displayed the correct solution and this led to additional questions and conversations. When creating this I decided to look back at some of the most engaging Demos activities that I’ve used. Most of them ended with some type of card sort. I decided to do the same.
I decided to have a “doesn’t have a match” column to increase students thinking. It took a while for students to complete this as certain criteria worked with only one shape while other statements didn’t match any. When I first created this I noticed that some of the statements that were created matched multiple shapes. Ooops. It was fixed before I gave it to my third graders, but that could’ve caused a few issues. After around 10 minutes we review the answers as a class.
Students self-checked their work to see how accurate they were. Some students didn’t actually match the statements completely. They brought the statement to the column, but didn’t attach them. I should’ve explained how to do this before completing the activity. This happened with around three students. The next time we completed an Desmos activity those students were fine and attached the statements. There’s a small learning curve with these types of activities and this was one of those moments.
My next step is to learn how about the computation layer and possibly how to use it more effectively with my K-3 students. I think it’d be great to be able to rotate or drag a shape on a coordinate grid. Students could then use a digital protractor to measure the internal and external angles. I’m also looking at how to use polygraphs more effectively next year. My students had a blast using them during the last week of school. Maybe I’ll learn about that during the summer. I’m looking forward to using this more with my elementary students next school year.
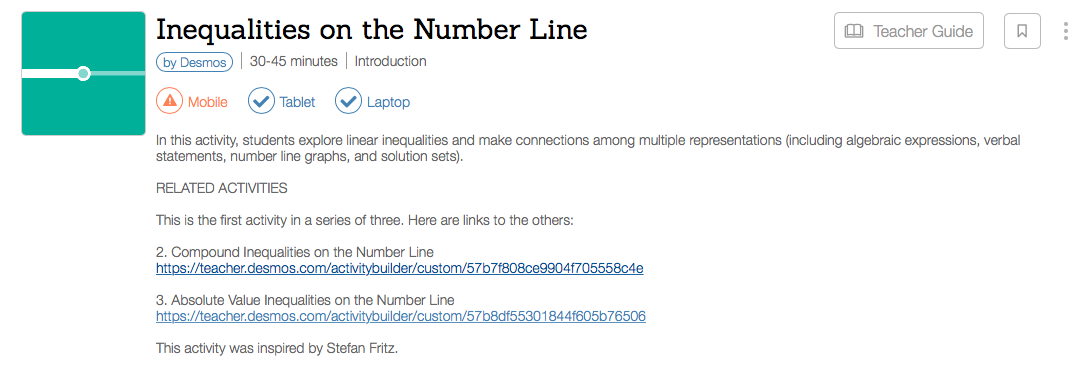
This week one of my classes spent a good amount of time investigating inequalities and absolute value. Both topics were brand new to students. I looked around in my math files and decided that there might be a better way to introduce inequalities. Students are familiar with number lines, math symbols and plotting points. They weren’t familiar with extending points and graphing inequalities. So, while jumping around Twitter I came across a Tweet talking about a Desmos lesson related to this particular topic.
I took a leap and decided to check it out. You see, I’m a Desmos newbie. I’ve heard many people within the #msmathchat and #mtbos talk about how it’s such an amazing tool. I haven’t had a chance to try it out until this week. My school isn’t 1:1 and technology is used from time to time, but less frequently in math classes. After reviewing the lesson and playing around I dived in and made a commitment to use the activity. I borrowed Chromebooks from a couple other teachers and had a sample run before starting it up on Tuesday.
Students started off by plotting points on number lines. They also made predictions of what their peers would place. During the first day, students made it through almost all of the activity. Students still had questions and they were answered as I paused the slides (I definitely like the pause function). Near the end of the lesson I thought students were becoming better at being able to identify inequalities and match them to graphs.
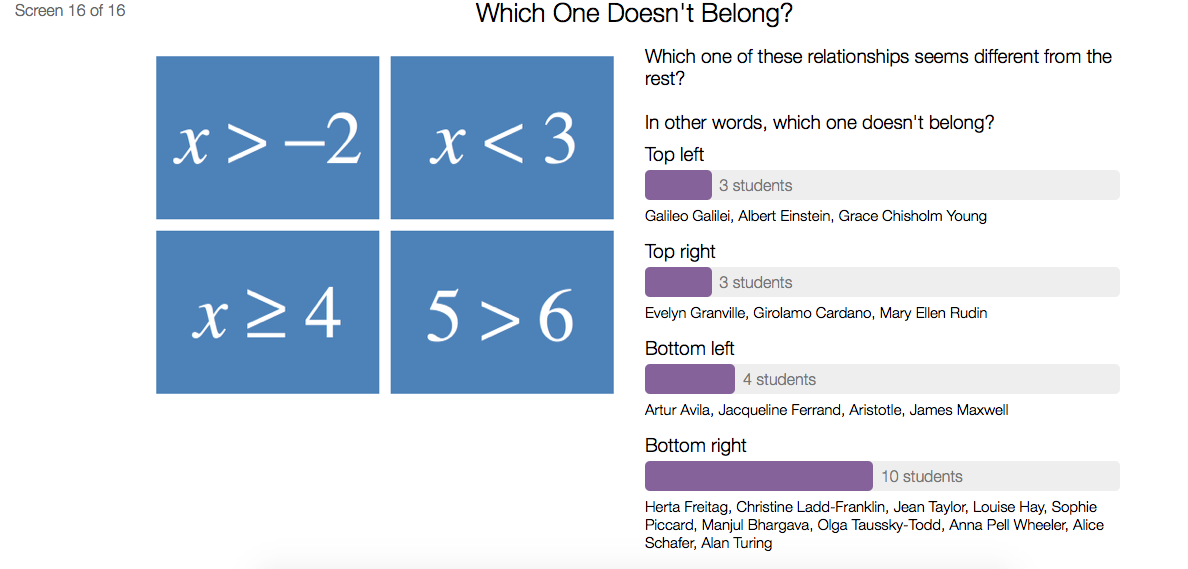
The following day students finished up the activity with a WODB digital board. It was interesting to hear their responses and reasoning behind them.
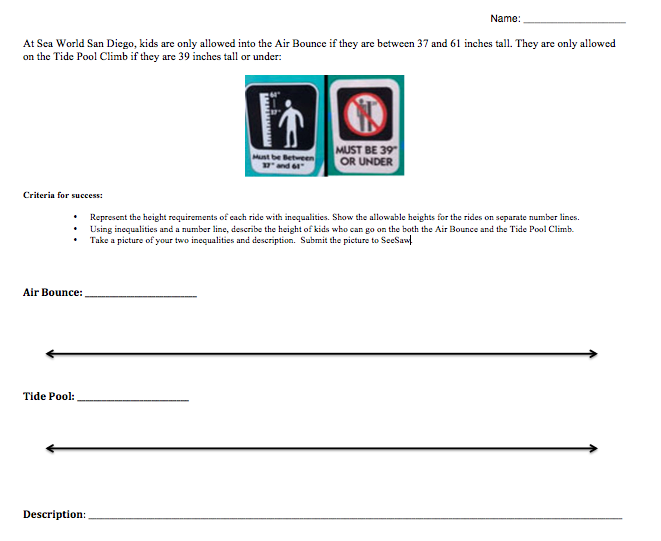
On Thursday, students took their inequalities journey a step forward. They were asked to complete an Illustrative Mathematics inequality task. Students were given a situation where they needed to write two inequalities, graph them on separate number lines, and create a description.
Students worked in stations, but completed each sheet on their own. The students had some productive discussions during this time. I have to remember to discuss the positive elements of this with the class after the weekend. Students had to create a number line and then plot points where necessary. They had to figure out if a close or open circle was needed and where the overlaps occur. The only hiccup occurred when discussing the word between.
Does the word between in this context include 37 and 61, or does it mean that it omits those numbers. Students went back and forth on this issue and we had a class conversation about that particular topic. Eventually, the class decided that 37 and 61 were included. Students turned in the task on Thursday and I returned them back today. Just a handful of students needed to retake the task, but it was mainly because the directions weren’t fully read or labels were missing.
Today the class explored absolute value and coordinate grids. A test is scheduled for next Wednesday, but I could probably spend a lot more time on this topic. The class will briefly investigate absolute deviation on Monday and complete a study guide on Tuesday.
I’ll end this post with a Tweet that made me think a bit about math instruction.
Love the term "instructional agility." We can't rely on just one strategy to reach our students. One strategy does not work for all. #gwaea
I believe “instructional agility” is necessary and teachers become more aware of this through experience. Instructional agility can also lend itself to the resources and tools that are used in the classroom.
Last week my students started to plot points on coordinate grids. They were identifying different quadrants and becoming more confident with drawing shapes on the plane. While reflecting on last week’s activities I noticed a Tweet that was sent our replying to one of my blog posts.
I’m a rookie when it comes to Desmos. Most of the stories I hear involve middle or high school students. I needed to find something that worked with my elementary kids. So I started to research and did a little bit of exploring to see how this could be used with my third grade class. I ended up looking up some of the templates but had a bit of trouble finding an extremely basic rookie-like coordinate plane activity for my students. I decided to go the route of creating a template and having students manipulate created points for a project. Click here for the template.
I quickly found that students had no idea how to use Desmos. I gave the students 5-10 minutes to orient themselves. Students were asked to move the points to certain coordinates on the grid. As they moved the points students started noticing that the tables on the left side of the screen changed. Students started connecting how the tables changed and this helped reinforce concepts learned last week. After this introduction time, students were given a rubric that contained the following:
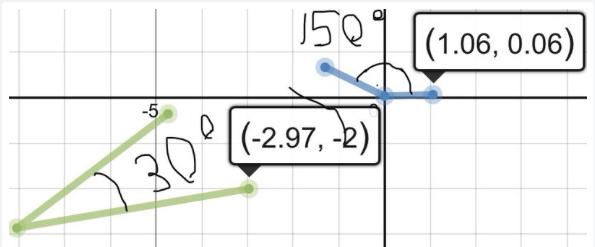
Move the points on the grid to create two angles
The angles need be located in two different quadrants
The angles need to be acute and obtuse with arcs located in each one
Indicate the measurement of each angle
Students were then given 15-20 minutes to create their projects.
Students created their angles by moving the points around the grid. Students then shared their projects with the class.
Students took a screenshot and then added the degree measurements to the angles. The class reviewed the projects and students explained how they plotted the points. This project seemed to help students make the connection between points and the x and y-coordinates. It also reinforced skills related to angle classification and measurements. I’m looking forward to expanding on this project next week.


 Students self-checked their work to see how accurate they were. Some students didn’t actually match the statements completely. They brought the statement to the column, but didn’t attach them. I should’ve explained how to do this before completing the activity. This happened with around three students. The next time we completed an Desmos activity those students were fine and attached the statements. There’s a small learning curve with these types of activities and this was one of those moments.