Volume and Missing Blocks

Screen Shot 2017-09-12 at 9.10.54 PM.png

On Monday my fourth grade crew worked on tasks related to perimeter and area.  Today they discussed volume. The volume discussion began when I brought out a large container filled with water.  I asked the students what they thought volume was.  Was it the amount of substance contained in an object or the space inside of the object?  It was interesting to hear their perspective.  I wrote down their thinking on the whiteboard. Some students were positive that volume measured how many cm cubes that could fit into the cylinder.  Another student stated that there wasn’t anymore volume left because the water took up the space.  I then took the same cylinder and dumped the water out.  Another student mentioned that you didn’t need to use cubes to fill up the cylinder.  You could’ve used sand instead to measure the volume.  Throughout this class conversation I thought students were testing their understanding of volume and not just regulating it to filling up objects with cubes. The class then made a math journal entry and created a t-chart of examples and non-examples of volume.

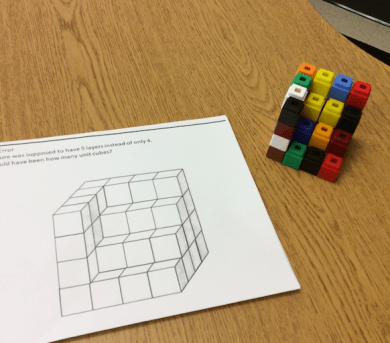
Afterwards, students went back to their table groups to discuss volume and I used Steve’s image from the tweet below.

I asked students to think about the shape and how many cubes might need to be added to create another layer.  Students were confused at first, but then gradually came around to thinking about how to add another layer.

Screen Shot 2017-09-12 at 9.10.43 PM

Some students wanted to add a layer on top, but then realized that making that top layer would mess up the stair sequence.  Eventually, after some major perseverance, I asked students to create a model.

Screen Shot 2017-09-12 at 9.10.50 PM.png

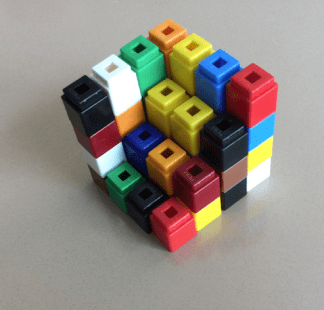
That model proved helpful as students could see and start thinking about how many blocks could be added to the bottom.  I noticed that students started to think of arrays and how helpful they were in creating another layer.

Screen Shot 2017-09-12 at 9.10.54 PM.png

At that point class ended.  We’ll be discussing this problem again tomorrow.  I’m looking forward to seeing what the students discover, their solutions, and what strategy they end up using.

Volume and Capacity

coffee

My fourth grade students are studying volume and capacity this week. As I introduced the topic earlier in the week I started to observe that students had a minimal understanding of volume. They remembered the l x w x h formula.  They remembered creating cities last year and finding the volume of different rectangular prisms. So I brought out my supply of centimeter cubes and the class built different rectangular prisms. Being able to replicate rectangular prisms with centimeter cubes was a great way to start off the lesson. Students reconnected (as we studied this last year and I kept on reminding them) the concrete and abstract models of rectangular prisms and volume. At this point the class started to explore the volume of different 3d shapes.   We had a few volume estimation drills with objects in the classroom. Students seemed to do well with triangular prism estimation (1/2 of the rectangular prisms) but had trouble with cylinders.   I had students work in groups to estimate the volume of a cylinder in the classroom.

They made their estimates in cubic centimeters. I thought that the centimeter cubes that I had on my desk would help students visualize the volume better. Students were given the formula to find the volume a cylinders but were still quite a bit off with their estimates. The class then calculated the actual volume.  After their first attempt the class started to pinpoint the errors. We made a list:

  • Adding the radius twice instead of multiplying ß most errors fell into this category
  • Using incorrect number for Pi
  • Used the diameter instead of the radius
  • Estimated using incorrect units
  • Rounded the measurement incorrectly

Keeping these errors in mind, our second volume attempts were closer. Not all, but most groups were on the right track and could visualize an approximate volume of the second cylinder. After all the results were collected the students and I measured the exact dimensions of the cylinder. I had a few students look astonished that the cylinder could “hold that many cubes.” They couldn’t believe it and didn’t think it was reasonable. So we went back to a different representation. I put the container under the document camera and we created an approximate layer of cubes on the bottom of the cylinder.

layer

Finding the radius wasn’t used for this demonstration. We added a few more cubes to add for the tiny spaces. The class found the height and used it along with Pi to estimate the volume.

height

That estimate was close to the actual measured amount. I could sense that students were developing more confidence as we moved into the next part of the lesson.  This seemed to make sense to the students. Being able to quickly backtrack to a different representation helped students see volume differently.

The next day students explored the similarities between cubic centimeters and milliliters. This was a challenge for some of the students and some didn’t believe that 1 cm3 was 1 ml. Part of the reason is that students are often used to working with volume and capacity in completely different situations. Liquid and solid measurements are often separated into different lessons and units. Rarely are they combined at the elementary level so this was fairly new to students. While researching a few different options in helping make connections I settled on using an activity that mimics this video.

I passed out the assignment and students were placed in groups.  I modeled how to start the assignment and answered questions.

volumeandcapacity.jpg


Students worked in groups and were given options in how to showcase their understanding of cubic centimeters and milliliters. Students filled up their graduated cylinders to specific levels and I added a small bit of food coloring. It’s so funny how fourth graders can get so excited over this. Note to self:  buy extra food coloring.  Students added actual centimeter cubes to the graduated cylinder and watched as the water level rose.

Students reviewed the difference between the water levels after cubes were dropped to the bottom of the graduated cylinder. Students then recorded their explanation to what happened and how cubic centimeters are equivalent to milliliters. We finished up the day with an exit card on volume.


Exploring Volume

Photo Apr 28, 1 07 42 PM

This week my third grade class explored volume and surface area concepts. Last week they used centimeter cubes to build a number of structures. Students transitioned from counting centimeter cubes to using a formula to find the volume of a rectangular prism.

Screen Shot 2015-05-02 at 3.37.10 PM

The next few math sessions in the week revolved around the concepts of identifying faces, edges, vertices, nets, and how all of those characteristics play a role in the volume of prisms. During the next day I asked students to create a net of a rectangular prism using 1cm grid paper. This was a struggle for some students. Being able to visualize the net, cutting it out and creating a prism was challenging. My class went through a LOT of grid paper during this process.  Students started out using trial-and-error and moved closer to a formula method.  After multiple attempts and some major perseverence, I decided to frame the next few lessons with a project.

I decided to dig into my Evernote account and combined a few projects that I’ve used or found through my PLN. I also spoke with a few colleagues in my school for feedback.  The project was going to take some time. I decided that although the project may take more time than individual lessons it was worth the time and gave students opportunities to learn more about the math concepts that were scheduled to be explored.

The project is called volume city. Students were given directions, a model map, 1 cm grid paper and a rubric. You can find the files that I used here. Essentially, students were asked to create a model city using rectangular prisms as buildings. The city had to have at least four basic buildings and students could add more if they desired. Students were required to write the dimensions of the buildings: length, width, height and volume.

Screen Shot 2015-05-02 at 6.46.44 PM

Students then used the grid paper to draw and cut out the net for that particular building.

Photo Apr 29, 1 17 39 PM

This was probably one of the more challenging aspects of the project, especially when the building wasn’t shaped like a cube.  Students had trouble drawing nets with different heights. Students were given more grid paper as needed. I think every group had to redraw or recut their nets two or more times. This was good in my mind, because it demonstrated that they made a mistake, but were trying again in an attempt to make improvements. The concept of visualizing the net and the action of creating them accurately started to combine as the project continued. I even had a few students decide to create the largest possible net using the entire grid paper.

Volume_City

So after students created the nets they decorated them and glued/taped them on the map sheet. Students filled out the dimension sheet as they created their prisms. Here’s one that’s almost complete.

Screen Shot 2015-05-02 at 6.13.11 PM

Not all of projects are complete, but the next phase of the project is for students to find the total volume of their model city. This will most likely take place as students will start taking the PARCC test next week and our math block is shortened. At some point we’ll also be exploring rates in the next unit. During that time we might use some type of stop-motion video of our model cities to look at the frames-per-second in our film.

%d bloggers like this: