Texas and Electricity Rates

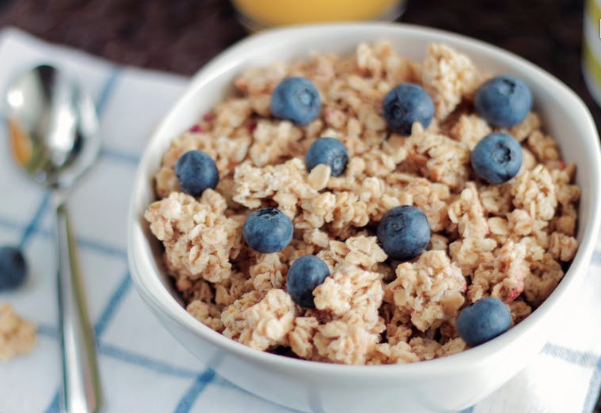
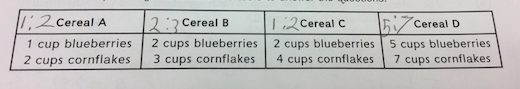
One of my classes has been exploring rates and ratios. We started off the lesson sequence by using tiles and eventually moved towards rate tables. The class used simulations and the paint Desmos deck. The class progressed nicely through the different ratio/rate models and late last week we began our final task of the unit. This task was adapted from the Chicago Everyday Math resource and I thought it was a nice blend between current events and rates.


In 2021, Texas was hit with a record winter storm. The storm knocked out power supplies across the state causing a shortage of electricity. Electricity is measured in kilowatt-hours. Customers are charged according to how many kilowatt-hours they use. An average household uses just over 30 kilowatt-hours per day.

Before the storm hit, customers who had a variable rate were paying on average about 12 cents per kilowatt-hour. Because of the shortage caused by the storm, some customers had their variable rates go up as much as 9 dollars per kilowatt-hour.

How much would a typical household on a variable rate contract pay for electricity for five days without a storm?

How much would a typical household on a variable rate contract pay for electricity for five days at 9 dollars per kilowatt-hour?

Why might some customers claim their bills are not fair?  Make a mathematical argument to justly your claim.


This was a challenge for students. Students read through the directions at least a couple times and still had questions. The questions dealt more with the significant difference between $9 per kilowatt hour compared to $0.12. They asked how that could be possible? Is that even legal? Why was it so cold in Texas? Is it because of climate change? I appreciated their curiosity and willingness to think about this as a fairness issue. This discussion lasted around 15-20 minutes. We then dove into creating a rate table.

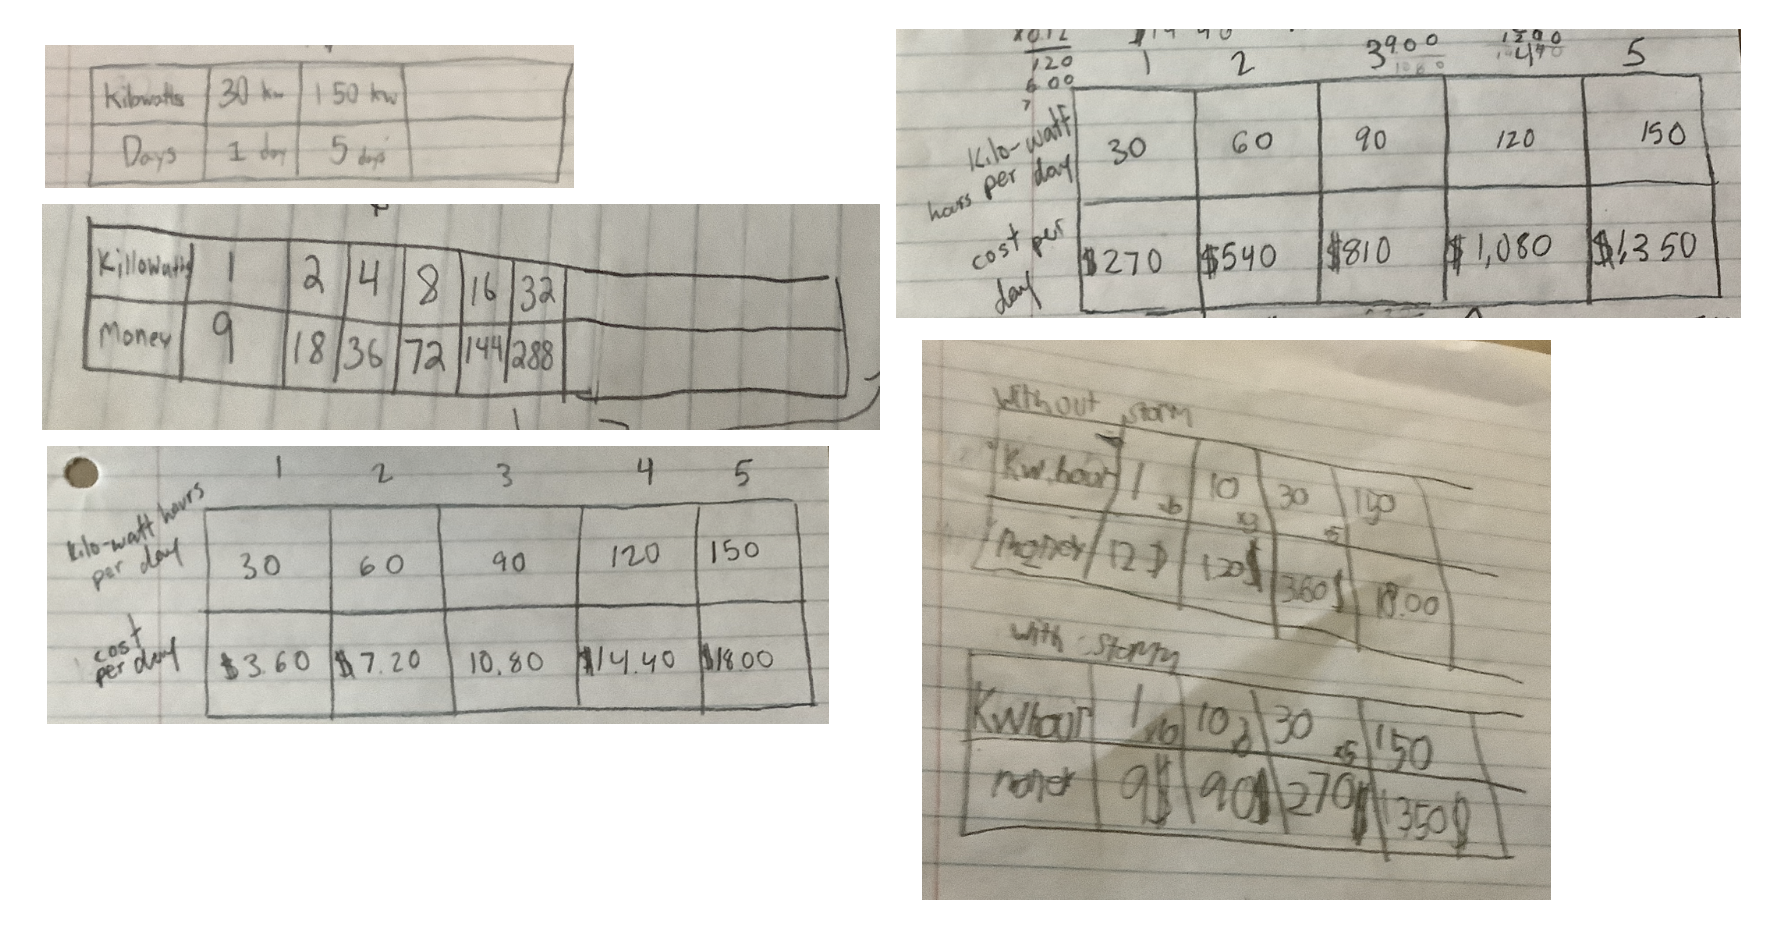
Students first found out how many kilowatt hours a typical family uses in five days.

Once students put together their rate tables they started to work on the written response.
The students were elaborate with their written responses. One of the more challenging aspects of this task was that students needed to create a mathematical argument. Students are not used to that type of questioning at fifth grade and the strategies involved in finding a solution.

I am looking forward to using more tasks like this throughout the school year.

Blueberry Cereal and Ratios

Screen Shot 2017-10-25 at 5.21.08 PM.png

One of my classes is in the midst of a unit on ratios.  Students have been exploring equivalent ratios and using visual models to compare them.  For the most part, it has been a great journey and students are making connections.

One of the common themes of this unit is for students to apply their understanding of ratios in real-world settings.  On Thursday, I introduced an activity about cereal and flavors.   This was my first time using this task so I wasn’t quite sure of what to expect.  Basically, students are given four different cereal recipes.  Each recipe has a certain number of cups of blueberries and cornflakes.

Screen Shot 2017-10-25 at 5.11.55 PM.png

The ratio is different for each cereal.  For example, cereal A has 1 cup of blueberries and 2 cups of cornflakes.   Students are then asked questions related to doubling, halving, making additional cups, and finding equivalent ratio recipes.   Students seemed to struggle at first and then created models, mostly tape diagrams, to find solutions.  Questions about making a certain cereal taste more like another were also part of this task.  Students had to stretch their understanding of ratios and apply it here. What I found was that some students struggled through this process.  Through the struggle, they moved towards using pictures/models to help themselves.

Screen Shot 2017-10-25 at 5.17.53 PM.png

This was where I stayed back and let students work.  That was tough. At times, I asked students questions to help move them towards validating their reasoning.  The application piece of taking ratios and using that understanding to see whether a cereal would taste more like blueberries or cornflakes was challenging for students.  They had to perceive the problem in an abstract sense, and then bring justification to why it would taste a certain way.

Screen Shot 2017-10-25 at 5.19.55 PM.png

Screen Shot 2017-10-25 at 5.17.08 PM.png

One of the more open-ended problems involved a taste test.  Students were asked to create a cereal with a  stronger blueberry taste than all the other cereals.  The kicker was that the new cereal couldn’t have more blueberries than cornflakes.  So, students were required to analyze all of the ratios and create a new ratio where the blueberry taste was more evident.  I observed that students tackled this problem in a couple different ways.  Some students perceived the problem as adding more cups of blueberries than any of the other cereals.  This caused an issue as the ratio wasn’t dependent on the amount of cups, but the actual ratio.

Screen Shot 2017-10-25 at 5.18.03 PM.png
Compared to what?

This was a red flag to me as students were looking at the value, not necessarily the ratio.  Other students took each ratio from the initial cereals and converted them into fractions.  They then created a fraction that was closer to one compared to the other cereal. This was used in their justification.

This task seemed like a worthwhile activity.  I’m looking forward to what tomorrow brings.

Proportions and Action Figures

Screen Shot 2017-04-04 at 8.41.53 PM.png

My fifth graders are in the middle of a unit on ratios and proportions.  Two weeks ago the fifth grade kids worked through a detective mystery.  It was a good start and a decent opportunity for students to explore proportions.  This week my students came back from spring break.  It took a while to get back to our regular schedule after a week off. We had to complete some review on Monday and started a new project today.  I was meaning to start it before break but we ran out of time.  I researched a few different sites (1,2,3) and decided to modified my original project.

The class began by talking about proportions and scale models.  The discussion lasted around five minutes and then we reviewed the concept and vocabulary with a Kahoot  The majority of kids were able to answer the questions using estimation, but many were challenging, which was good because we were able to stop and use different strategies.  Most students wanted to cross-multiply for everything, but by the end of the activity students were starting to see the value in diversifying their strategies.  I felt like spending time on this was worthwhile.  This experience reminded me of a Tweet from #msmathchat from last night.

Afterwards, I introduced the action figure project to the students.  Students measured the dimensions of the action figures.  They measured the figure in millimeters, converted it to centimeters and eventually to inches.

Screen Shot 2017-04-04 at 8.27.05 PM.png

They then measured their own dimensions with a partner and compared them to the action figure.

Screen Shot 2017-04-04 at 8.06.17 PM.png

Screen Shot 2017-04-04 at 8.26.51 PM.png

Many of the students were able to use proportions as a tool to find a solution.  Some students had a bit of trouble tackling the issue of converting the units.  Overall though, students are becoming better and using different strategies to solve proportion problems – an #eduwin in my book.  You can access the files that I used for this project here.


%d bloggers like this: