At some point during the last week of the school year I generally have my classes take a survey. The survey is designed to provide feedback and to reflect on learning experiences that have occurred throughout the year. The survey is composed of questions about the class in particular, favorite memories, different learning experiences, and feedback on how I’m perceived. For the past few years the classes and I review the survey data together before the students write their final reflections. For this post I took out the learning experience pieces and am focusing in on teacher perception.
Survey Directions:
I read through the directions with the class and answered a few clarifying questions. Students weren’t required to submit their name. Students took about 20 – 30 minutes to complete the survey. I averaged the classes together and the results are below.
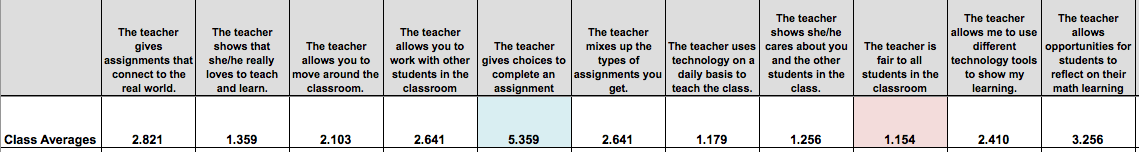
I’ll be showing the class the chart above tomorrow. Before doing that, I’m going ask the students what they think are the top 3. In the past I usually compile the list into the “top 3” and then the class discusses the results and implications on how these categories impact learning in the classroom. This is always a rich discussion that evolves into an understanding that feeling safe and respected in a classroom often encourages academic risk taking. Here are the top 3 we will be discussing tomorrow:
- The teacher is fair to all students in the classroom – 1.154 / 10
- The teacher uses technology to teach the class – 1.179 / 10
- The teacher shows that she/he really loves to teach and learn – 1.359 / 10
I’ll then show the bottom 3:
- The teacher gives choices to complete an assignment – 5.39 / 10
- The teacher allows opportunities for students to reflect on their learning – 3.256 / 10
- The teacher gives assignments that connect to the real world – 2.821 / 10
During this time the class will be tackling questions about what’s important in a typical classroom. The class discussions during this time are so important. This type of reflective thinking is purposefully planned to encourage students to take part in understanding how their environment and mindset plays a pivotal role in the learning process.
My takeaways
I think teachers can be extremely critical of their own practice. I tend to focus more on the areas of improvement, but I think it’s important to share this data with the students as one way to model a growth-mindset. I was surprised to see that reflecting on learning scored lower than others. By low, I just mean it wasn’t rated as highly as others. This year I’ve utilized student reflection sheets, but only really using them after assessments. I feel like I need to merge more opportunities for students to reflect throughout a math unit of study, not just at the end. I’m also willing to explore different avenues to reflect. Instead of using the same sheet, possibly using multiple forms of reflection may help. This is something I’m going to work on over the summer and have in place for next school year.
Also, what’s interesting is that as grade levels progress from lower elementary to upper elementary, assignments connecting to the real world decrease. I’m not totally surprised as there’s a large emphasis on algebraic equations for my upper elementary classes. The algebra concepts and practices are often disconnected from practical use. Again, I’d like to find a way to change this perception.
I’m excited to see that students feel safe and feel like I’m fair in the classroom. The environment and having positive rapport with students can go a long way in having students exceed their own expectations. Also, even though it wasn’t in the top 3, I’m proud to see that students feel that they can use technology to demonstrate their learning. This has been a huge emphasis this year with my student content creation theme.
Overall, using student survey data can be a valuable experience. The transparency that it provides can encourage students to take additional risks. Looking towards next year, I might want to give a similar survey earlier in the year and then closer to the end. That way we can look at the growth of the class. Regardless, I feel like the moments we have to reflect on our learning experiences and survey data are well spent. This time can can help revisit learning experiences and offer an opportunity to cement an authentic enjoyment in understanding mathematics.

3 thoughts on “End of the Year Survey Data”