
My fifth graders started off the week learning more about fractions. On Monday students used a visual model to multiply mixed numbers. The visual model was a bit challenging for students to grasp. Many of the students knew parts of a multiplication algorithm, but not necessarily how to show the computation visually.

It took a decent amount of modeling and experimenting, but I believe completing the visual models increased students’ understanding of fraction computation. After a decent dose of the visual model, students were introduced to a fraction multiplication algorithm. I tried to make the connections between the algorithm and visual model as apparent as possible. Many students made the connections, but not all.
Around mid-week students started to divide fractions. Again, I started off the discussion around using a visual model to show the division.
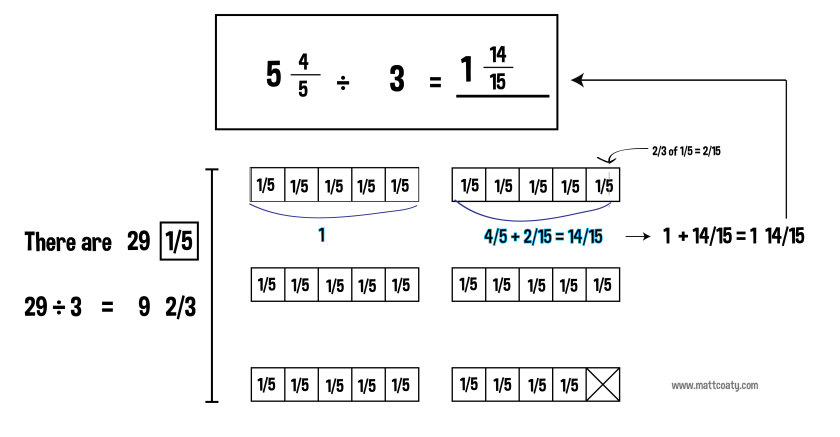
This time students were more confident in creating the visual models, although some wanted to jump to the standard algorithm. This stopped once I included the visual model as part of the steps required to solve the problem. Some of the students that had trouble creating the visual model for fraction multiplication started to become more comfortable with the division model. This was good news. The most challenging part for my students was finding a fraction of fractional pieces.
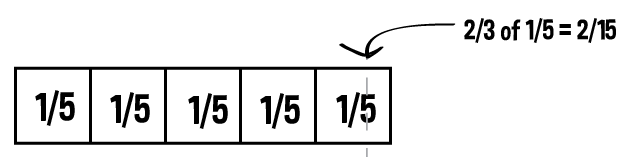
This was solved once students realized that “of” meant to multiply and then they were able to find a solution. The class had many light-bulb moments as students made connections between the visual model and standard algorithm. Also, one of the additional benefits was observing students look at the reasonableness of their answers. This was more apparent when students created a visual model first. The class will be sharing their models next week.

I’m finding that there’s power in using visual models. The opportunity to use trial-and-error with visual models has many benefits. It’s a low-risk opportunity that allows for multiple entry points. Students are making sense of fractions before moving to the standard algorithm. It might not be the most efficient way to compute fractions (as students continue to find out), but I believe students will have a better understanding when they can visualize fractional pieces and then use a process to find the solution. At some point students will be shown a visual model and be asked for the computation. I feel as though students were steadily building their conceptual understanding of fractions this week.

One thought on “The Power of Visual Models”