Over the past few years, my approach to teaching rounding has followed a similar path. The choice of methodology was often influenced by the adopted textbook within a school district. I would generally guide students to place numbers on a number line and determine their proximity to the nearest value. The class would focused on rounding to the nearest tens, gradually progressing to hundreds and eventually expanding to larger place values.
We would introduce a rule that involved underlining the digit to the right of the one being rounded. The rule states that if the underlined digit is “5 or more, round up; if it’s 4 or less, keep it the same.” I believe this has even been turned into a song at some point. This linear progression served as the foundation for teaching rounding at the early elementary level.
This year brought about a change in our district as elementary teachers adopted a new resource. The emphasis shifted to exploring the value of numbers even before delving into the concept of rounding. Students were tasked with identifying the value of specific digits and ordering them, whether from greatest to least or vice versa. We incorporated the use of base-ten blocks and relied on expanded form extensively to help students develop a deeper understanding of number formation and the impact of place value on value itself. Students became more familiar with the value associated with each digit within a four or more digit number.
Students began identifying the closest multiple of a given number. For instance, they would determine the nearest multiple of 10,000 for a number like 432,000. This transition was seamless because students had already explored multiples and factors earlier in the year. Understanding how multiples relate to rounding was a novel approach and it resonated well with the students. Now, when asked to round to a specific digit, students consider the nearest multiple, which seems to make more sense to them. I am excited to continue using a similar rounding teaching strategy moving forward.
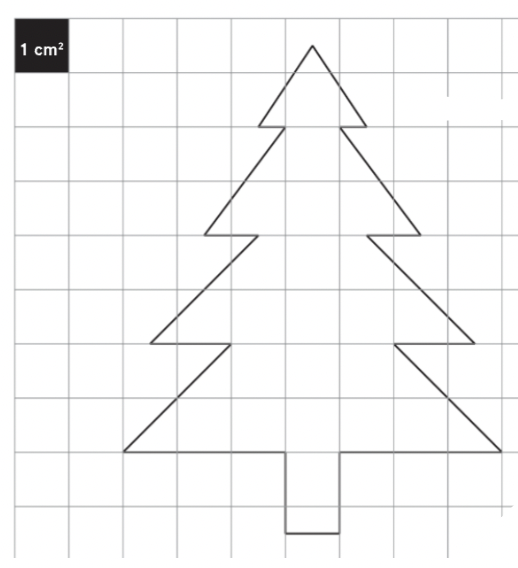
One of my classes has been exploring area lately. They started by counting squares and differentiating between what is considered area and perimeter. Students were able to add halves and reasonably estimate what the area of a rectangle, parallelogram and triangle would be based on a brief observation. Becoming precise was not valued early on in the process but proved to be a tough transition as students were expected to use formulas later in the unit. Late last week students were asked to find the area of the shape below.
At first students were fairly confident in being able to find the area. They quickly counted up the squares that were fully visible. Then added the halves or what they perceived as half.
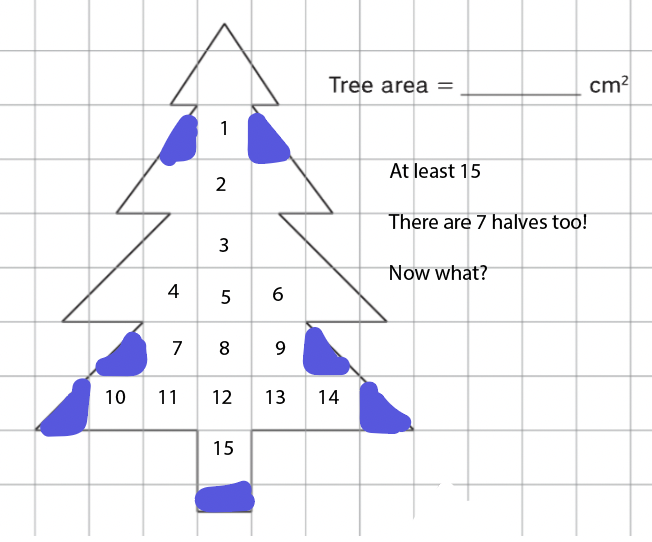
Students knew that there were at least 15 full squares covered and then added the halves. Estimates were given based on the full squares visible and ranged from 20 to 45. Confidence waned during this time as some students erased the numbers and started to deconstruct the shape into smaller shapes.
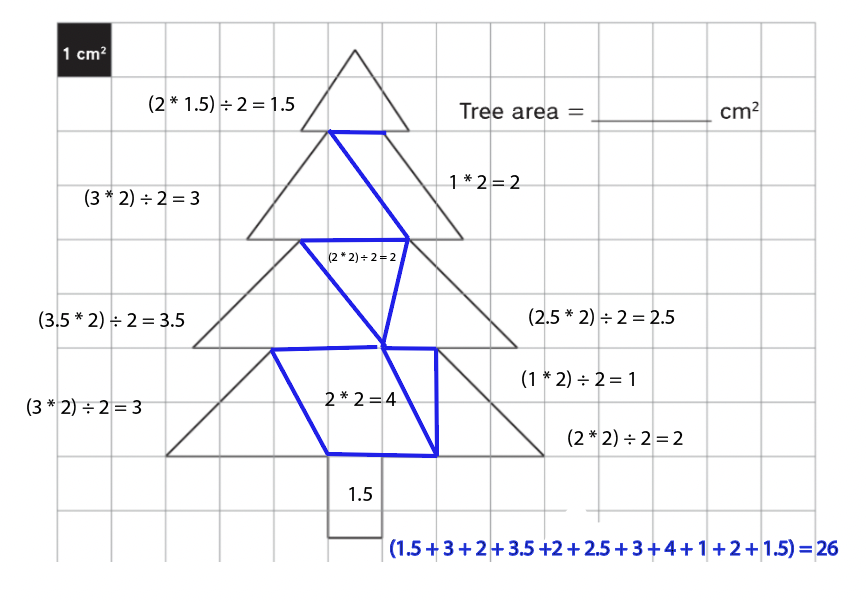
Earlier in the unit students made the connection that the area of a triangle can be found by using a rectangle method. Students also explored how parallelograms can be modified and rearranged into a rectangle.
Using that understanding, a number of students tried different methods to find the area of the shape. Students worked in groups to find a common understanding of where to start and how to dismantle the shape into parallelograms, triangles and rectangles.
This group decided to split apart the shape into triangles and rectangles. They specifically used the rectangle method to find the area of the triangles and counted the middle.
Another group tried a hybrid approach with mostly triangles and two parallelograms. The problem that this group had was trying to decide what constitutes the base and height of each triangle.
The other group decided to split one side of the shape into triangles and the other side into parallelograms. When I showed this to the class I received a few shocked looks. They were amazed at how simple this looked and yet they came up with the correct answer.
Overall, this was a time consuming task, but I feel like it was worthwhile. Students were able to think about math and measurement a bit differently. There are more efficient ways, but not one right way to complete the task. I am hoping that students remember this task and build upon their understanding as we move towards additional measurement concepts next school year.
My classes have been recently exploring fraction division. Students completed word problems involving dividing fractional pieces and they were finding the idea challenging. In order to gain clarity, I worked with students in small groups to determine where the trouble spots seemed to developed. I started to notice a couple things: 1) students were relying on a fraction division algorithm without context 2) students were not sure how to determine the dividend, which made creating a number model problematic.
Relying on the traditional fraction division shortcut ended up causing problems for more than a few of my students. Students were not able to explain their reasoning for flipping the second fraction. This become even more apparent when students attempted fraction division word problems. Because you have to “flip” the second fraction students were not sure how to identify the dividend. This caused confusion. I planned out a small fraction bootcamp for students to explore fraction division through visual models. Students started out with problems like 2 ÷ 1/4 and progressed to where a fraction is in the divisor and dividend. Students were making progress and relying less on the shortcut method, although some used that to check their work.
After our mini camp, students were given prompts to show their understanding of fraction division.
1.) Juliane has 12 bags of confetti to spread on 16 tables. She wants to put the same amount of confetti on each table. How much of one bag of confetti should she put on each table?
This was the first problem and achieved the highest accuracy. Students drew out the 12 bags and spread it on 16 tables, finding the answer to be 12/16. Some showed a number model of 12 ÷ 16 = 12/16 and others drew a picture.
2.) Write a number story that can be modeled by 4 ÷ 5 = 4/5
This was more challenging. The number stories indicated whether a students could determine what was being shared and in how many pieces. It was interesting to read the responses and revealed an understanding of what is being split equally. Here are a few response:
There were 4 candy bars and 5 children. How much of the candy bars will each child get?
I have 4 boxes of apples and I wanted to put them in 5 bags and all the bags have the same amount of apples. How much of the box of apple go into the bags?
Tyler has 4 rats and 5 carrots for his rats to each get equally fed how much will each rat get?
There were 4 oranges jamal and his four friends wanted to spilt the oranges to a even amount how much of and orange does each person get?
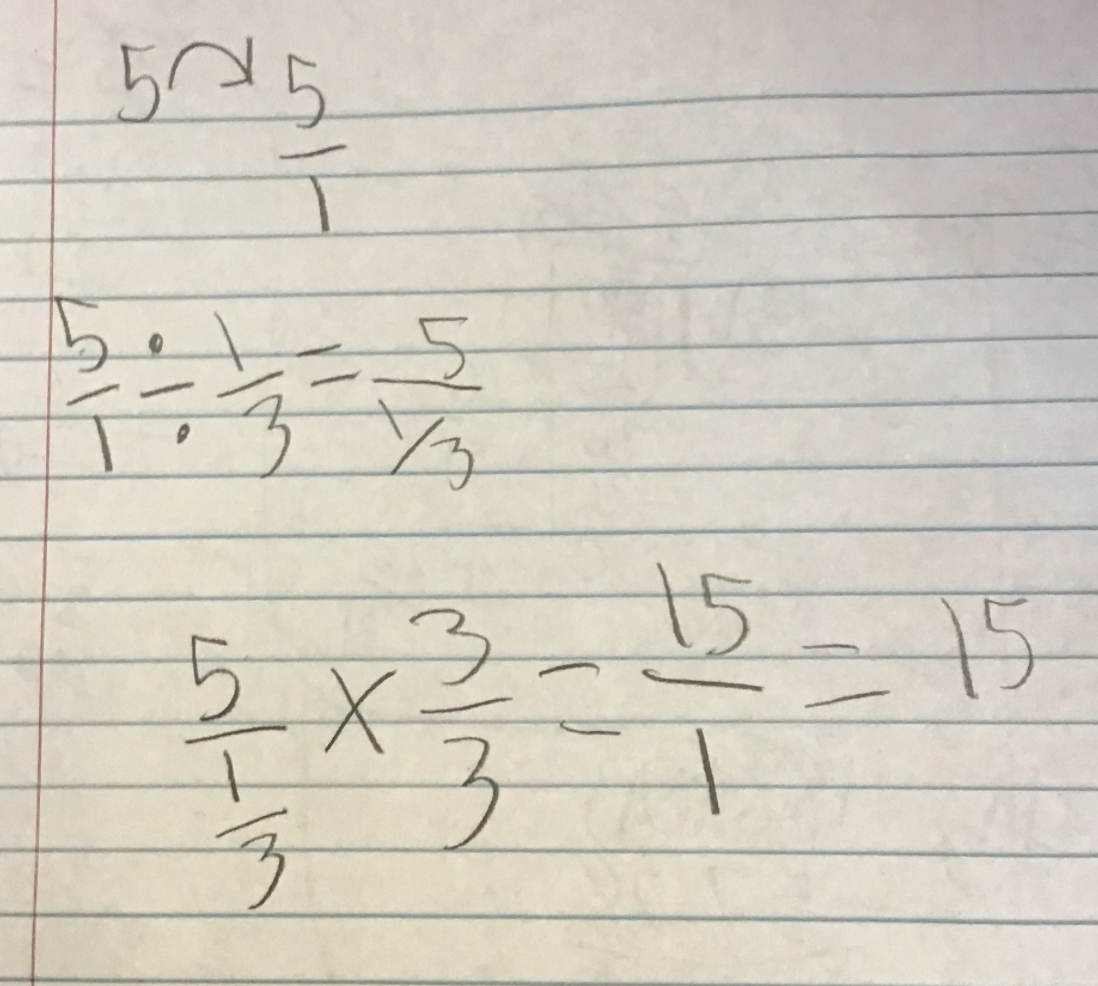
3. Explain using words and the process you would use to complete the problem 5 ÷ 1/3. Give the reason why you completed each step.
This problem caused a few student headaches – but in a good way. Students that relied on the shortcut were confused in how to explain the reasoning for flipping the second fractions. Out of all of the problems, this one highlighted the conceptual understanding of fraction division the most. Some students sent in pictures with written explanations while others created number models. Here are a few of the responses:
First I would do 5 ÷ 1/3 This works, because it is the same question just written ina different way. Next I would see how many 1/3 can fit in 5. To do this I would do 5*3. This works, because there is 3 1/3’s I one. And there is 5 ones in 5*3 = 15. So the answer is 15. (appreciate the thorough thinking behind this response!)
First I switched 5 to 5/1 and then 5/1 to 15/3. Why I did this is to make the denominators the same same number. Then I divided across numerators and denominators to get 15/1 then I simplified 15/1 to get 15. Why I divided across numerators and denominators is to get the answer. Why I simplified to make the number a whole number.
I think the answer is 15 because you can think about how many 1/3 are in 5 and that answer is the answer to your problem.
First I converted 5 to 5/1 then I did 5/1 divided by 1/3 to get 5/1/3 then I did 5/1/3 X 3/3 to get 15/1 which I simplified into 15
I was pleasantly surprised to see the improvement in being able to navigate fraction division. Being able to conceptually understand fraction multiplication/division can sometimes be a roadblock for students. I am hoping to break that and looking forward to discussing and highlighting a few student examples with the class next week.
Last week I had the opportunity to attend the IAGC conference. I don’t attend every year, but this year I went with a colleague because we both were presenting. For those that might not be aware, this conference is really geared towards gifted education in the state of Illinois. Administrators and teachers primarily attend this conference. It’s a multi-day conference that’s hosted in a Marriot in Naperville. I believe last year there was around 500 people (I’m estimating) attend – so it’s more of a smallish conference compared to some of the other education powerhouses in the the state. The freezing temperatures impacted attendance this year as driving conditions probably kept some away.
Most of the attendees that I saw last week are teachers that work with students with exceptional needs. Many of the teachers created sub plans and then school ended up being canceled because of the cold weather. Go figure. Whenever I’m asked to be out of the classroom for a meeting, conference, workshop, etc … I always am wondering if it’s truly worth the sub plans – kinda joking here.
What I enjoyed more particularly about this conference was that some of the presenters were teachers. Certainly not all, but there were a few sessions that I attended that involved teachers presenting to an audience. Some of the themes were related to acceleration, leadership, curriculum, social-emotional and equity with identification. I attended on Thursday and was able to attend a couple sessions – mostly related to curriculum and differentiation.
There’s a practicality component that is involved when a teacher is having a conversation with another educator. Most of the sessions were small enough that you could engage with the presenter by just raising your voice. Love that. I find it similar to an edcamp experience as individuals have a similar understanding of what’s expected in schools. There’s a large difference (at least from what I see) between teachers currently in the classroom and those that aren’t.
Now onto the sessions … I attended a session related to using adapted software in the classroom. Hearing positive ideas about how to use these in the classroom was different since I’m usually not too fond of this type of learning. The presenter gave a brief overview of a couple paid/free adaptive programs and spent a good amount of time answering questions about how to use them in the classroom. Another session emphasized the use of Jacob’s Ladder scaffolding techniques. The questions from the participants spurred additional questions – love when that happens. Later in the day Cheryl and I presented on using math routines in the classroom. Participants that attended offered their own ideas on routines that they found helpful.
It was truly an engaging experience to hear how others use and differentiate math routines. It was also refreshing to connect with other educators outside of our local area about how to create more meaningful math experiences for students. I think teachers need to explore outside of their district boundaries from time to time. Discussing some of the routines afterwards was also encouraging.
All in all, it was decent conference and worth the sub plans. I left with a better understanding of how certain tools and strategies can help meet the needs of exceptional students. I’m looking forward to the conference next year.
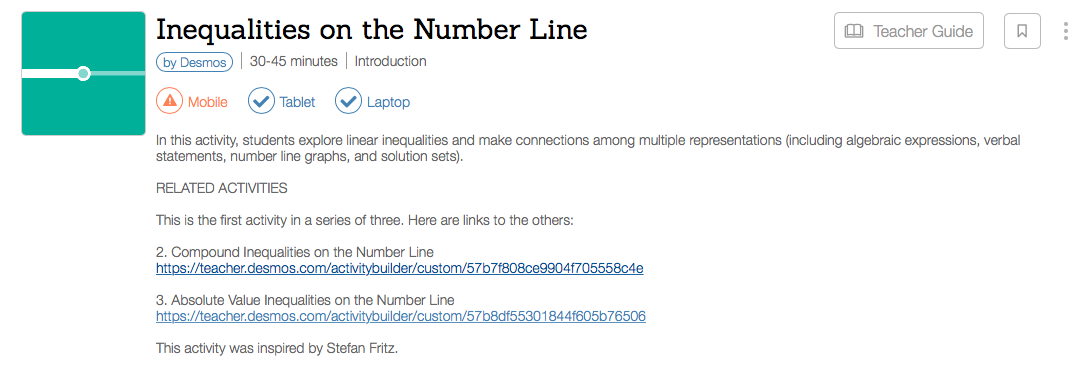
This week one of my classes spent a good amount of time investigating inequalities and absolute value. Both topics were brand new to students. I looked around in my math files and decided that there might be a better way to introduce inequalities. Students are familiar with number lines, math symbols and plotting points. They weren’t familiar with extending points and graphing inequalities. So, while jumping around Twitter I came across a Tweet talking about a Desmos lesson related to this particular topic.
I took a leap and decided to check it out. You see, I’m a Desmos newbie. I’ve heard many people within the #msmathchat and #mtbos talk about how it’s such an amazing tool. I haven’t had a chance to try it out until this week. My school isn’t 1:1 and technology is used from time to time, but less frequently in math classes. After reviewing the lesson and playing around I dived in and made a commitment to use the activity. I borrowed Chromebooks from a couple other teachers and had a sample run before starting it up on Tuesday.
Students started off by plotting points on number lines. They also made predictions of what their peers would place. During the first day, students made it through almost all of the activity. Students still had questions and they were answered as I paused the slides (I definitely like the pause function). Near the end of the lesson I thought students were becoming better at being able to identify inequalities and match them to graphs.
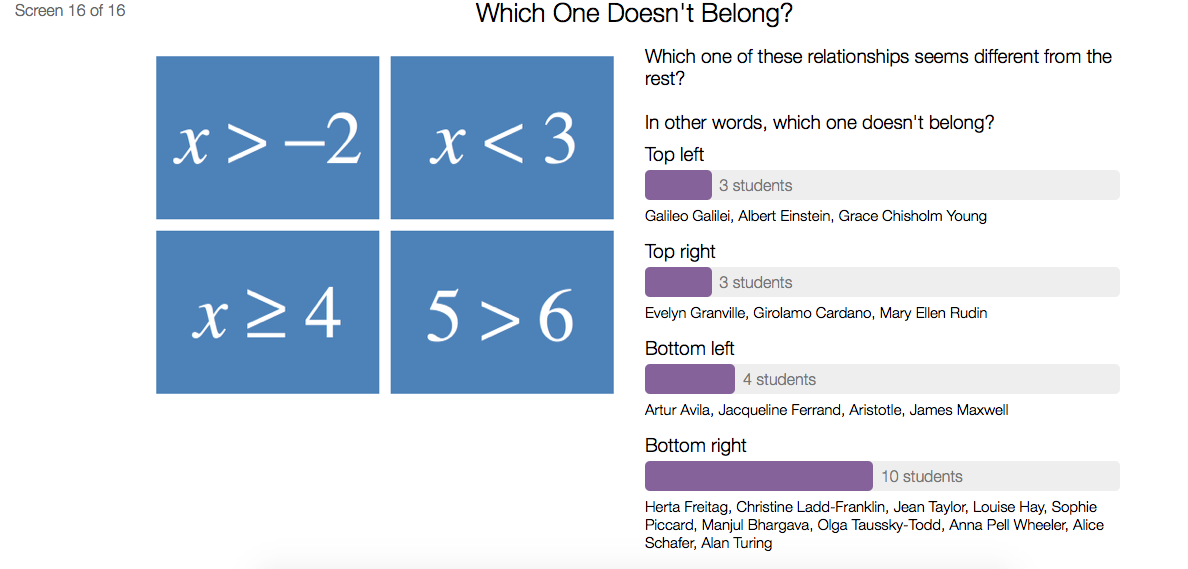
The following day students finished up the activity with a WODB digital board. It was interesting to hear their responses and reasoning behind them.
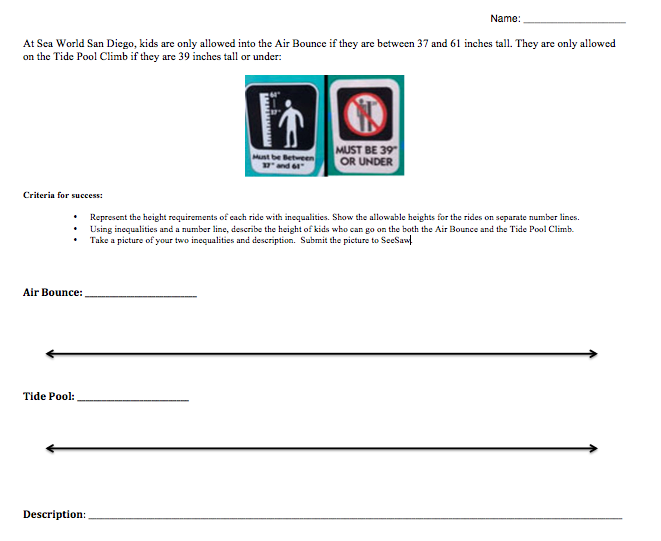
On Thursday, students took their inequalities journey a step forward. They were asked to complete an Illustrative Mathematics inequality task. Students were given a situation where they needed to write two inequalities, graph them on separate number lines, and create a description.
Students worked in stations, but completed each sheet on their own. The students had some productive discussions during this time. I have to remember to discuss the positive elements of this with the class after the weekend. Students had to create a number line and then plot points where necessary. They had to figure out if a close or open circle was needed and where the overlaps occur. The only hiccup occurred when discussing the word between.
Does the word between in this context include 37 and 61, or does it mean that it omits those numbers. Students went back and forth on this issue and we had a class conversation about that particular topic. Eventually, the class decided that 37 and 61 were included. Students turned in the task on Thursday and I returned them back today. Just a handful of students needed to retake the task, but it was mainly because the directions weren’t fully read or labels were missing.
Today the class explored absolute value and coordinate grids. A test is scheduled for next Wednesday, but I could probably spend a lot more time on this topic. The class will briefly investigate absolute deviation on Monday and complete a study guide on Tuesday.
I’ll end this post with a Tweet that made me think a bit about math instruction.
Love the term "instructional agility." We can't rely on just one strategy to reach our students. One strategy does not work for all. #gwaea
I believe “instructional agility” is necessary and teachers become more aware of this through experience. Instructional agility can also lend itself to the resources and tools that are used in the classroom.
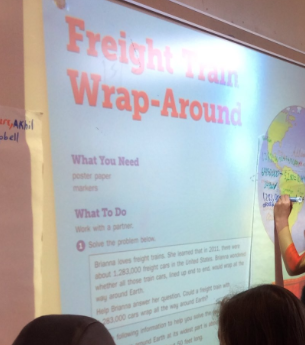
My fourth grade students are exploring exponents this week. Students are learning how to write numbers in exponential form and covert the numbers to standard form. For the most part, students have had a productive week learning how to write very large and small numbers. Later in the week, I decided to have students complete a team task enrichment project. Students were asked to compute large numbers. Here’s the Freight Train Wrap-Up prompt:
Brianna loves freight trains. She learned that in 2011, there were about 1,283,000 freight cars in the United States. Brianna wondered whether all those train cars, lined up end to end, would wrap all the way around the Earth. Help Brianna answer her questions. Could a freight train with 1,283,000 cards wrap all the way around the Earth?
I reviewed the criteria for success with the students and then placed them in teams. Students were asked to use an anchor chart to show their mathematical thinking. They could use markers, and other materials to showcase their solutions. Students were given around 20 minutes to work in their teams to find an answer. Some students drew pictures, while others decided on writing out equations. I heard a number of groups argue about the solution and what to compute. After about 15 minutes, most groups were close to finishing.
After the time was up, I brought the students to the front of the room. I briefly communicated all the different solutions that were evident. Students were asked to participate in a gallery walk. Gallery walks are used as a standard default activity for district meetings so I decided to try it out with my own class.
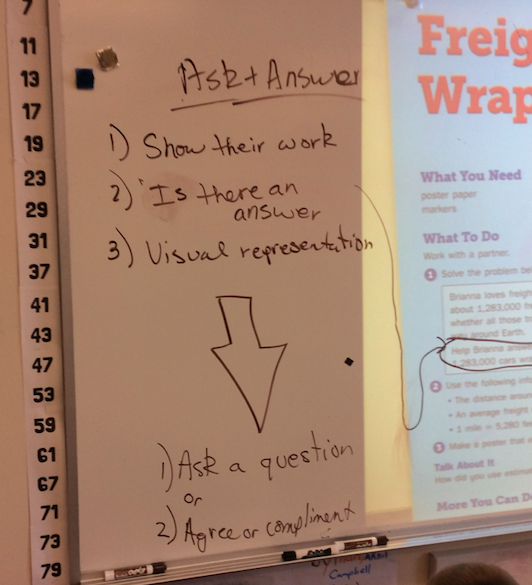
Students were then given three different Post-it notes. Each note was intended to ask students to indicate whether the chart that they were viewing answered these questions: 1) Did the team show their work? 2) Was there a solution? 3) Was there a visual representation? The note also indicated a question or an agreement.
Students efficiently traveled from group to group. They gave feedback and mostly agreed with what the other groups came up with. Students weren’t allowed to give feedback on their own anchor charts.
I then brought the students back to the front and we went through the problem together. We discussed the numbers, operations needed, and possible solutions. Students then went back to their original charts to read the feedback. Some students were surprised at the comments while others wanted to debate them immediately. I was able to touch base with each group and discuss what the constructive criticism might have meant. Students spend a decent amount of time talking with one another about their chart and process. Afterwards, students went back to their seats and prepared to leave.
This type of activity went well. After thinking about it I might consider doing something like this once every month or so. Also, I might need to think about how to get my hands on more anchor chart paper.
My second and third graders started a unit on fractions last week. Students are used to identifying typical pie fraction pieces. Generally, I find students are introduced to fractions using this type of visual representation. Students then count the amount of pieces and place that number as the numerator. I find moving towards mixed-numbers has some students changing their strategy as they can’t just count the pieces, but they have to recognize that a certain amount of equal parts are one whole. Based on their pre-assessment results, it seems as though my second grade and some of my third grade students are at this point.
Using a number line has helped. Placing the fractions on the line has brought a better understanding of the placement of fractions in relation to a whole number. Currently, students can identify certain benchmark fractions on a number line. We’re working on bolstering this skill and connecting it to fraction computation in the near future. Before that happens I want to ensure that they have a decent understanding of mixed numbers and where they fall on a number line.
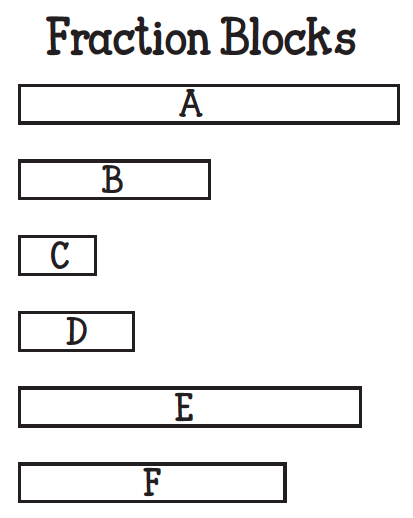
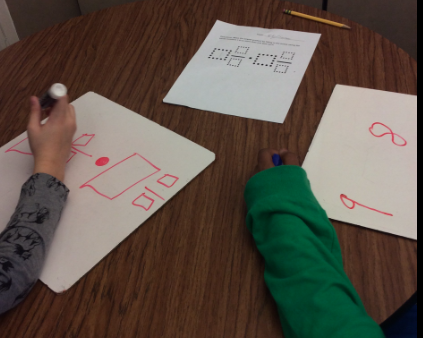
On Thursday and Friday I introduced students to a fraction block activity. Students were given a sheet with fraction parts. Each block was split into a certain amount of equal square parts.
Each student was given an envelope to put their pieces in once they were finished with the activity. Students cut out each block and were asked to put them in order from least to greatest value. Students were able to complete the task.
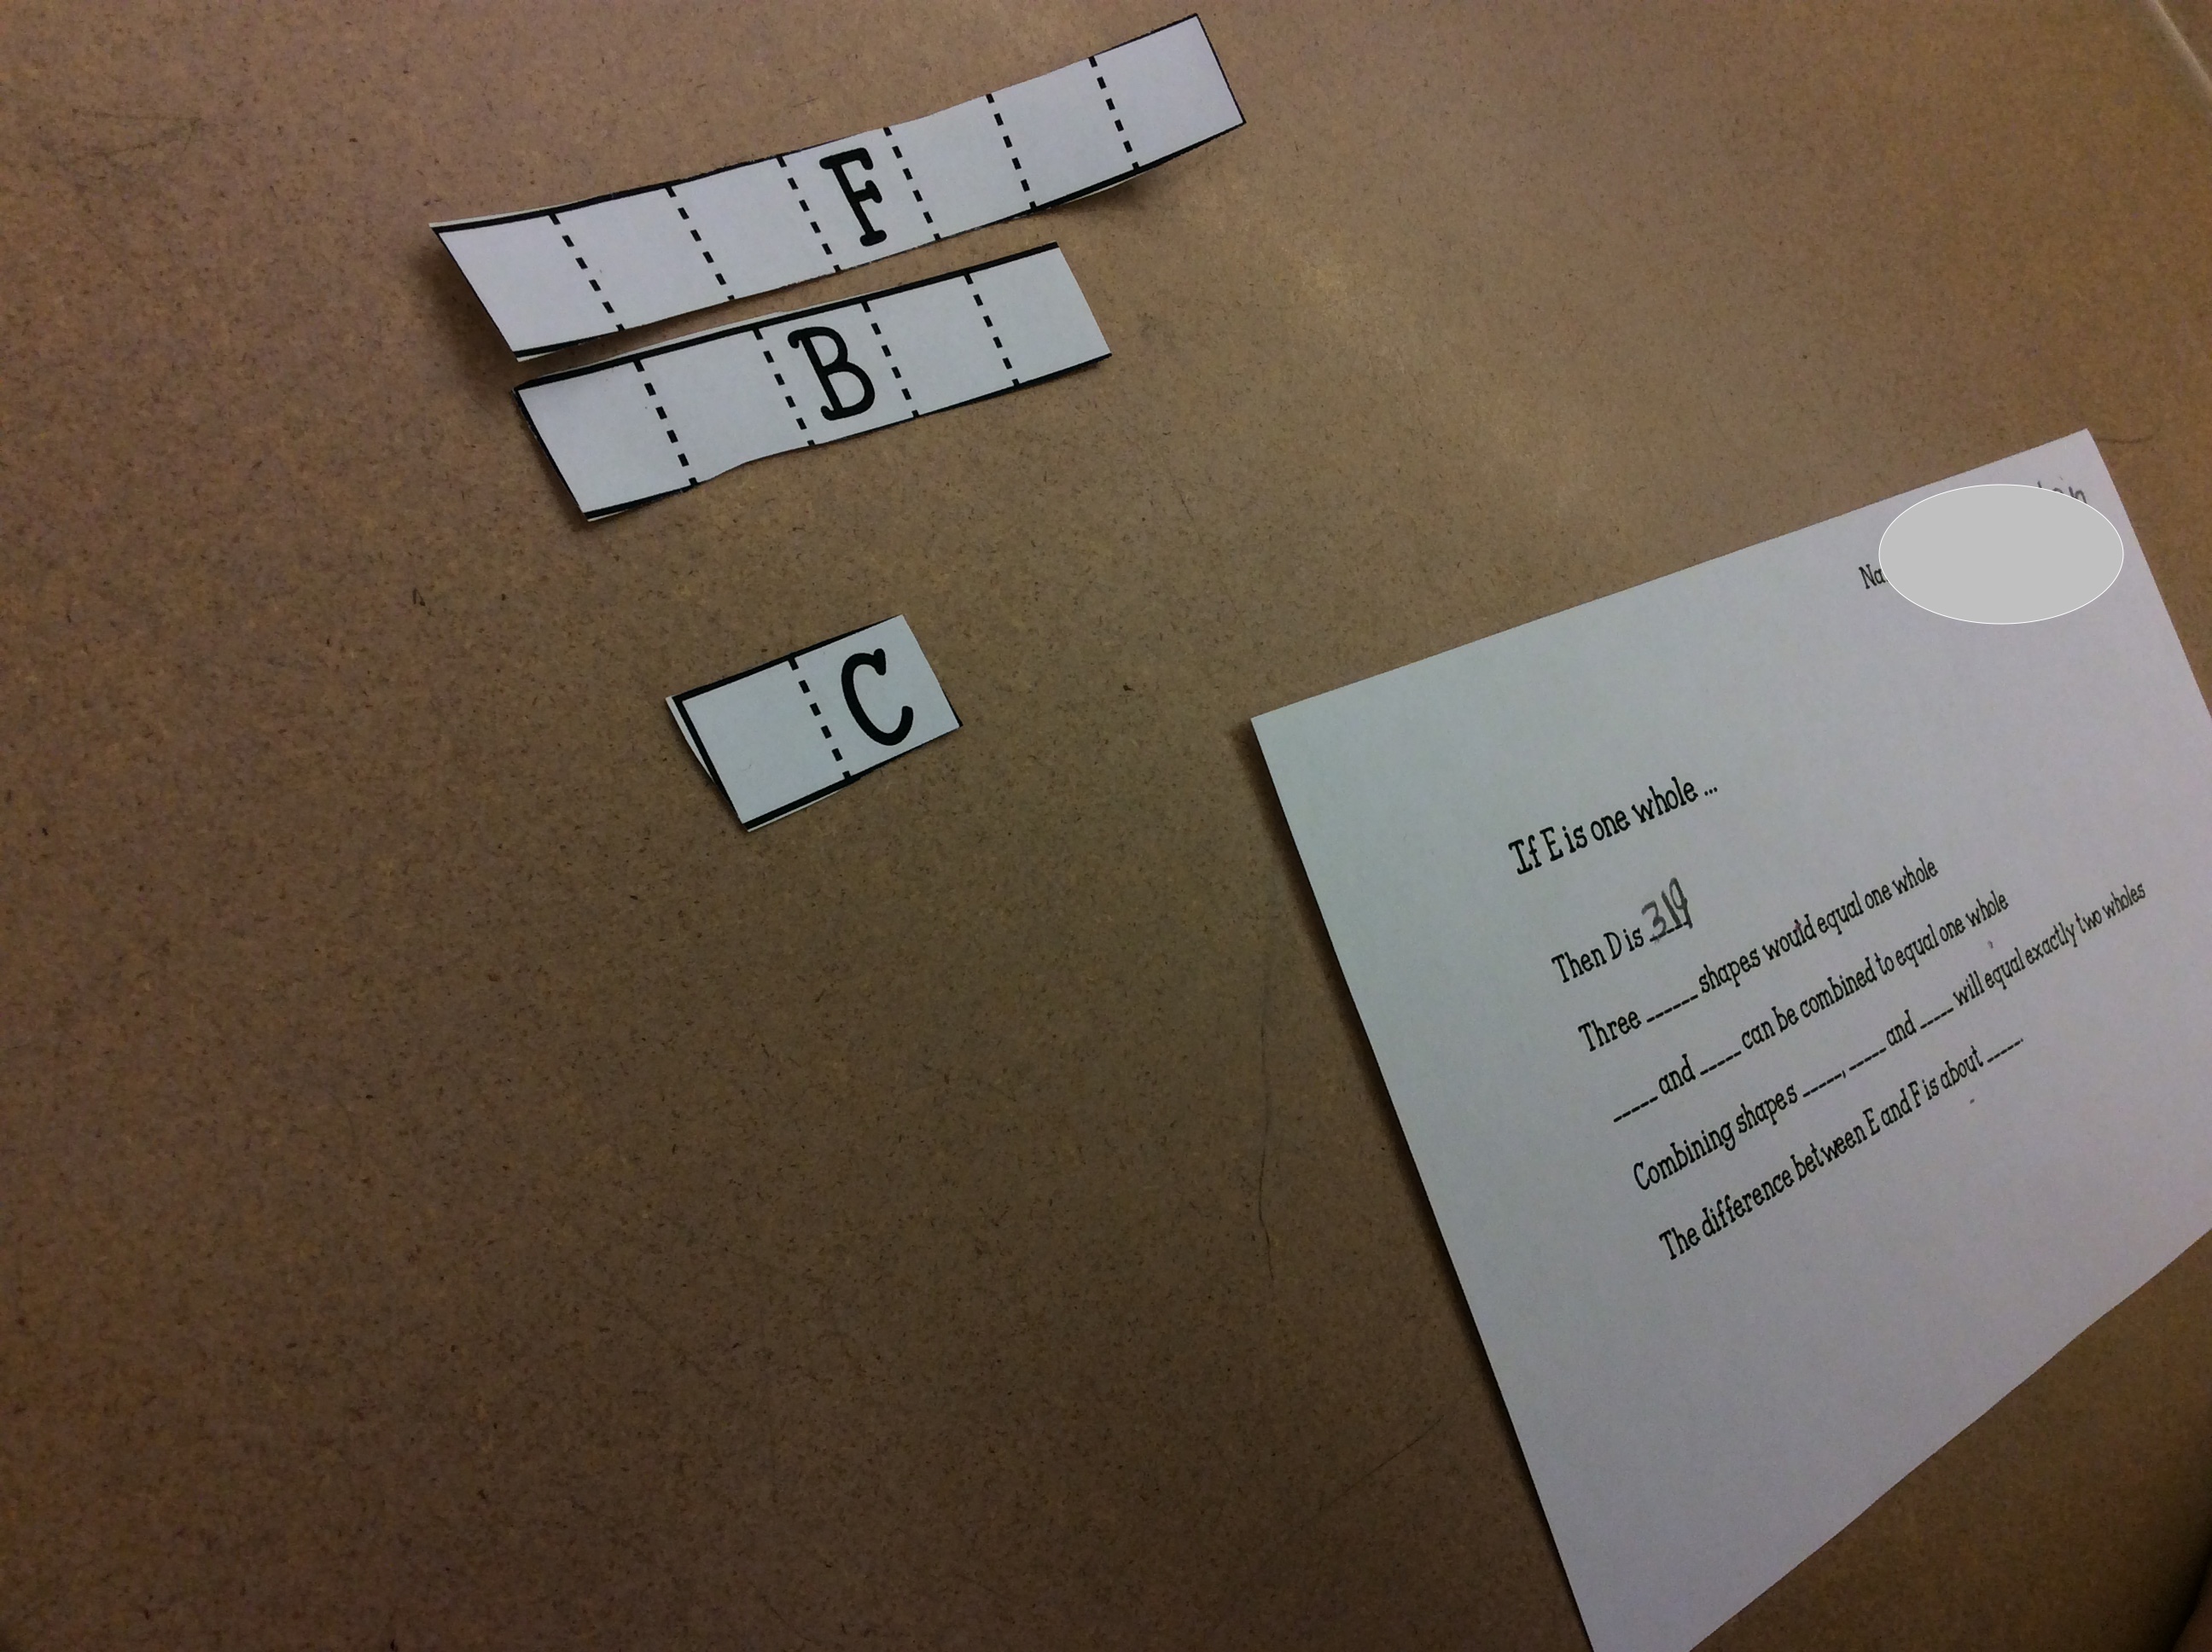
We then had a conversation about quarters, halves and wholes. I then gave each student the card below.
Students placed the A block near the top of their desk and started comparing the different blocks. The class completed the first question together.
I then gave students time to work on the rest of the problems. Students were then given time to use trial-and-error to find which blocks worked for each problem. I went around to the different table groups and asked students questions about their strategies. Students ended up matching the squares with other shapes to determine what was a quarter, half, almost a half, and what happens when you combine shapes. After about 10 minutes the class reviewed the sheet and found that some problems could be answered with multiple solutions. Students put the sheets in their envelopes since we ran out of time.
The next day students completed some more challenging half-sheets involving their blocks.
Students struggled a bit with this as they had to look at A as half instead of one whole. This changed the value of all of the other blocks. I allowed students to work in groups for about five minutes and then independently for another five. This gave them an opportunity to gain another perspective and a different strategy. Afterwards, I reviewed the possible solutions with the class.
Next week I’m taking this activity one step further and using the blocks without markings. I’m borrowing this idea from Graham’s post on defacing manipulatives.
Students will complete similar half-sheets, but without the evident markings. I’m looking forward to seeing how students’ strategies change and the math conversations that follow next week. Click here to download the activity that I used.
My fourth and fifth grade classes explored fraction models this week. I enjoy teaching about the concept at both of these levels concurrently. I can see the linear progression of skills associated with fractions and the different perceptions of fractions. My fourth grade crew is finding equivalent fractions while my fifth graders are multiplying/dividing fractions. Both groups are finding success, but I’m also seeing similar struggles. Students are fairly consistent with being able to convert mixed numbers to fractions and combine fractions. Issues still exist in being able to estimate fraction computation problems and determining which operation to use while completing word problems
This year I’ve been focusing in on making sure students are using estimation strategies. This is especially important when dealing with fractions and eventually decimals. Unfortunately, I tend to find that time spent on the process (algorithm) trumps the reasonableness (estimate) from time to time. Part of this is due to past math experiences and time management. After the last assessment on fractions, I started to look for additional ways to incorporate estimation within my fraction unit. I came across Open Middle last year and I’m finding their fraction resources to be a great addition. Both, my fourth and fifth graders completed a few different Open Middle fraction problems this week.
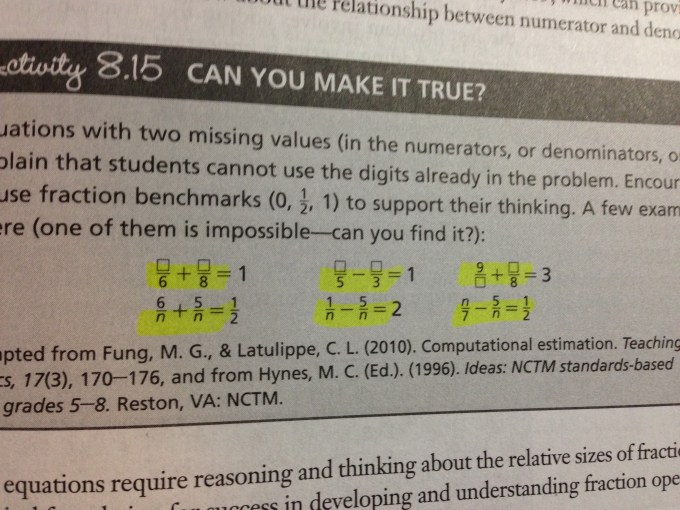
I’m finding that students are estimating a lot more when they are involved in these types of activities. The tasks I use from OpenMiddle emphasize the need to estimate first and calculate second. These types of puzzles are interesting for students. They are low-risk, but yet have a high ceiling. I also found this to be evident with an activity that I found out of this book. I can’t say enough good things about the ideas and resources found within that resource.
Students had to find the missing numerator, denominator or variable. In both, the Open Middle and Make it True activity, student worked in groups of 2-3. I gave them about 10-15 minutes to collaborate. The sheet below was adapted from the book above.
Fifth graders worked on this for 10-15 minutes. Class discussion followed
They shared ideas, estimated and came to a consensus on what the solution should be. I had the student groups write their answers on the board and the class discussed all the different solutions afterwards. The class conversation incorporated a decent amount of review and also gave an opportunity for students to ask for clarification. I’m looking forward to having more classes like this. The class conversation component that occurs after a collaborative effort is starting to become an even more valuable piece of my math instruction.
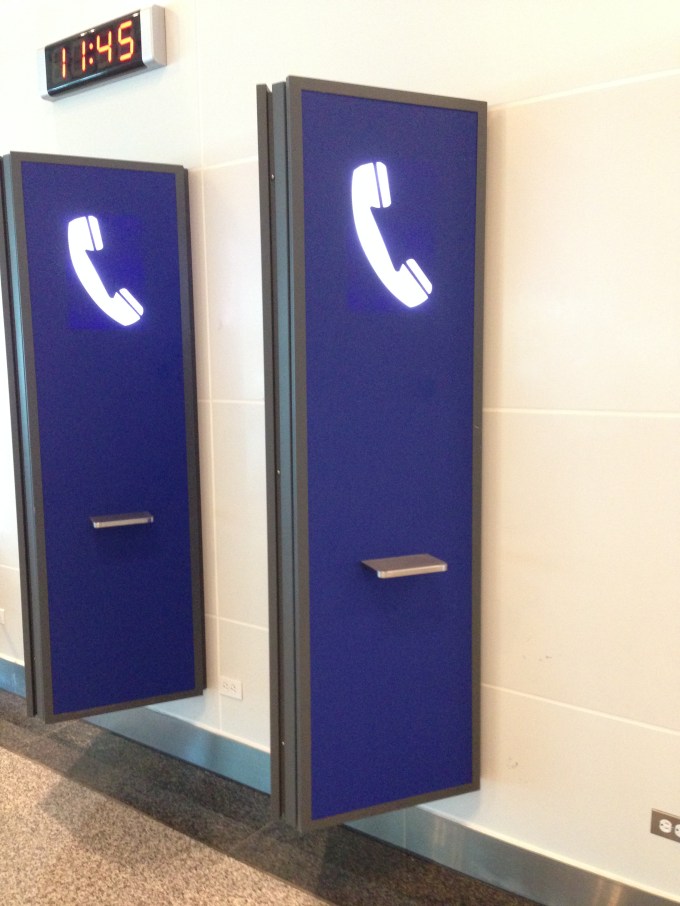
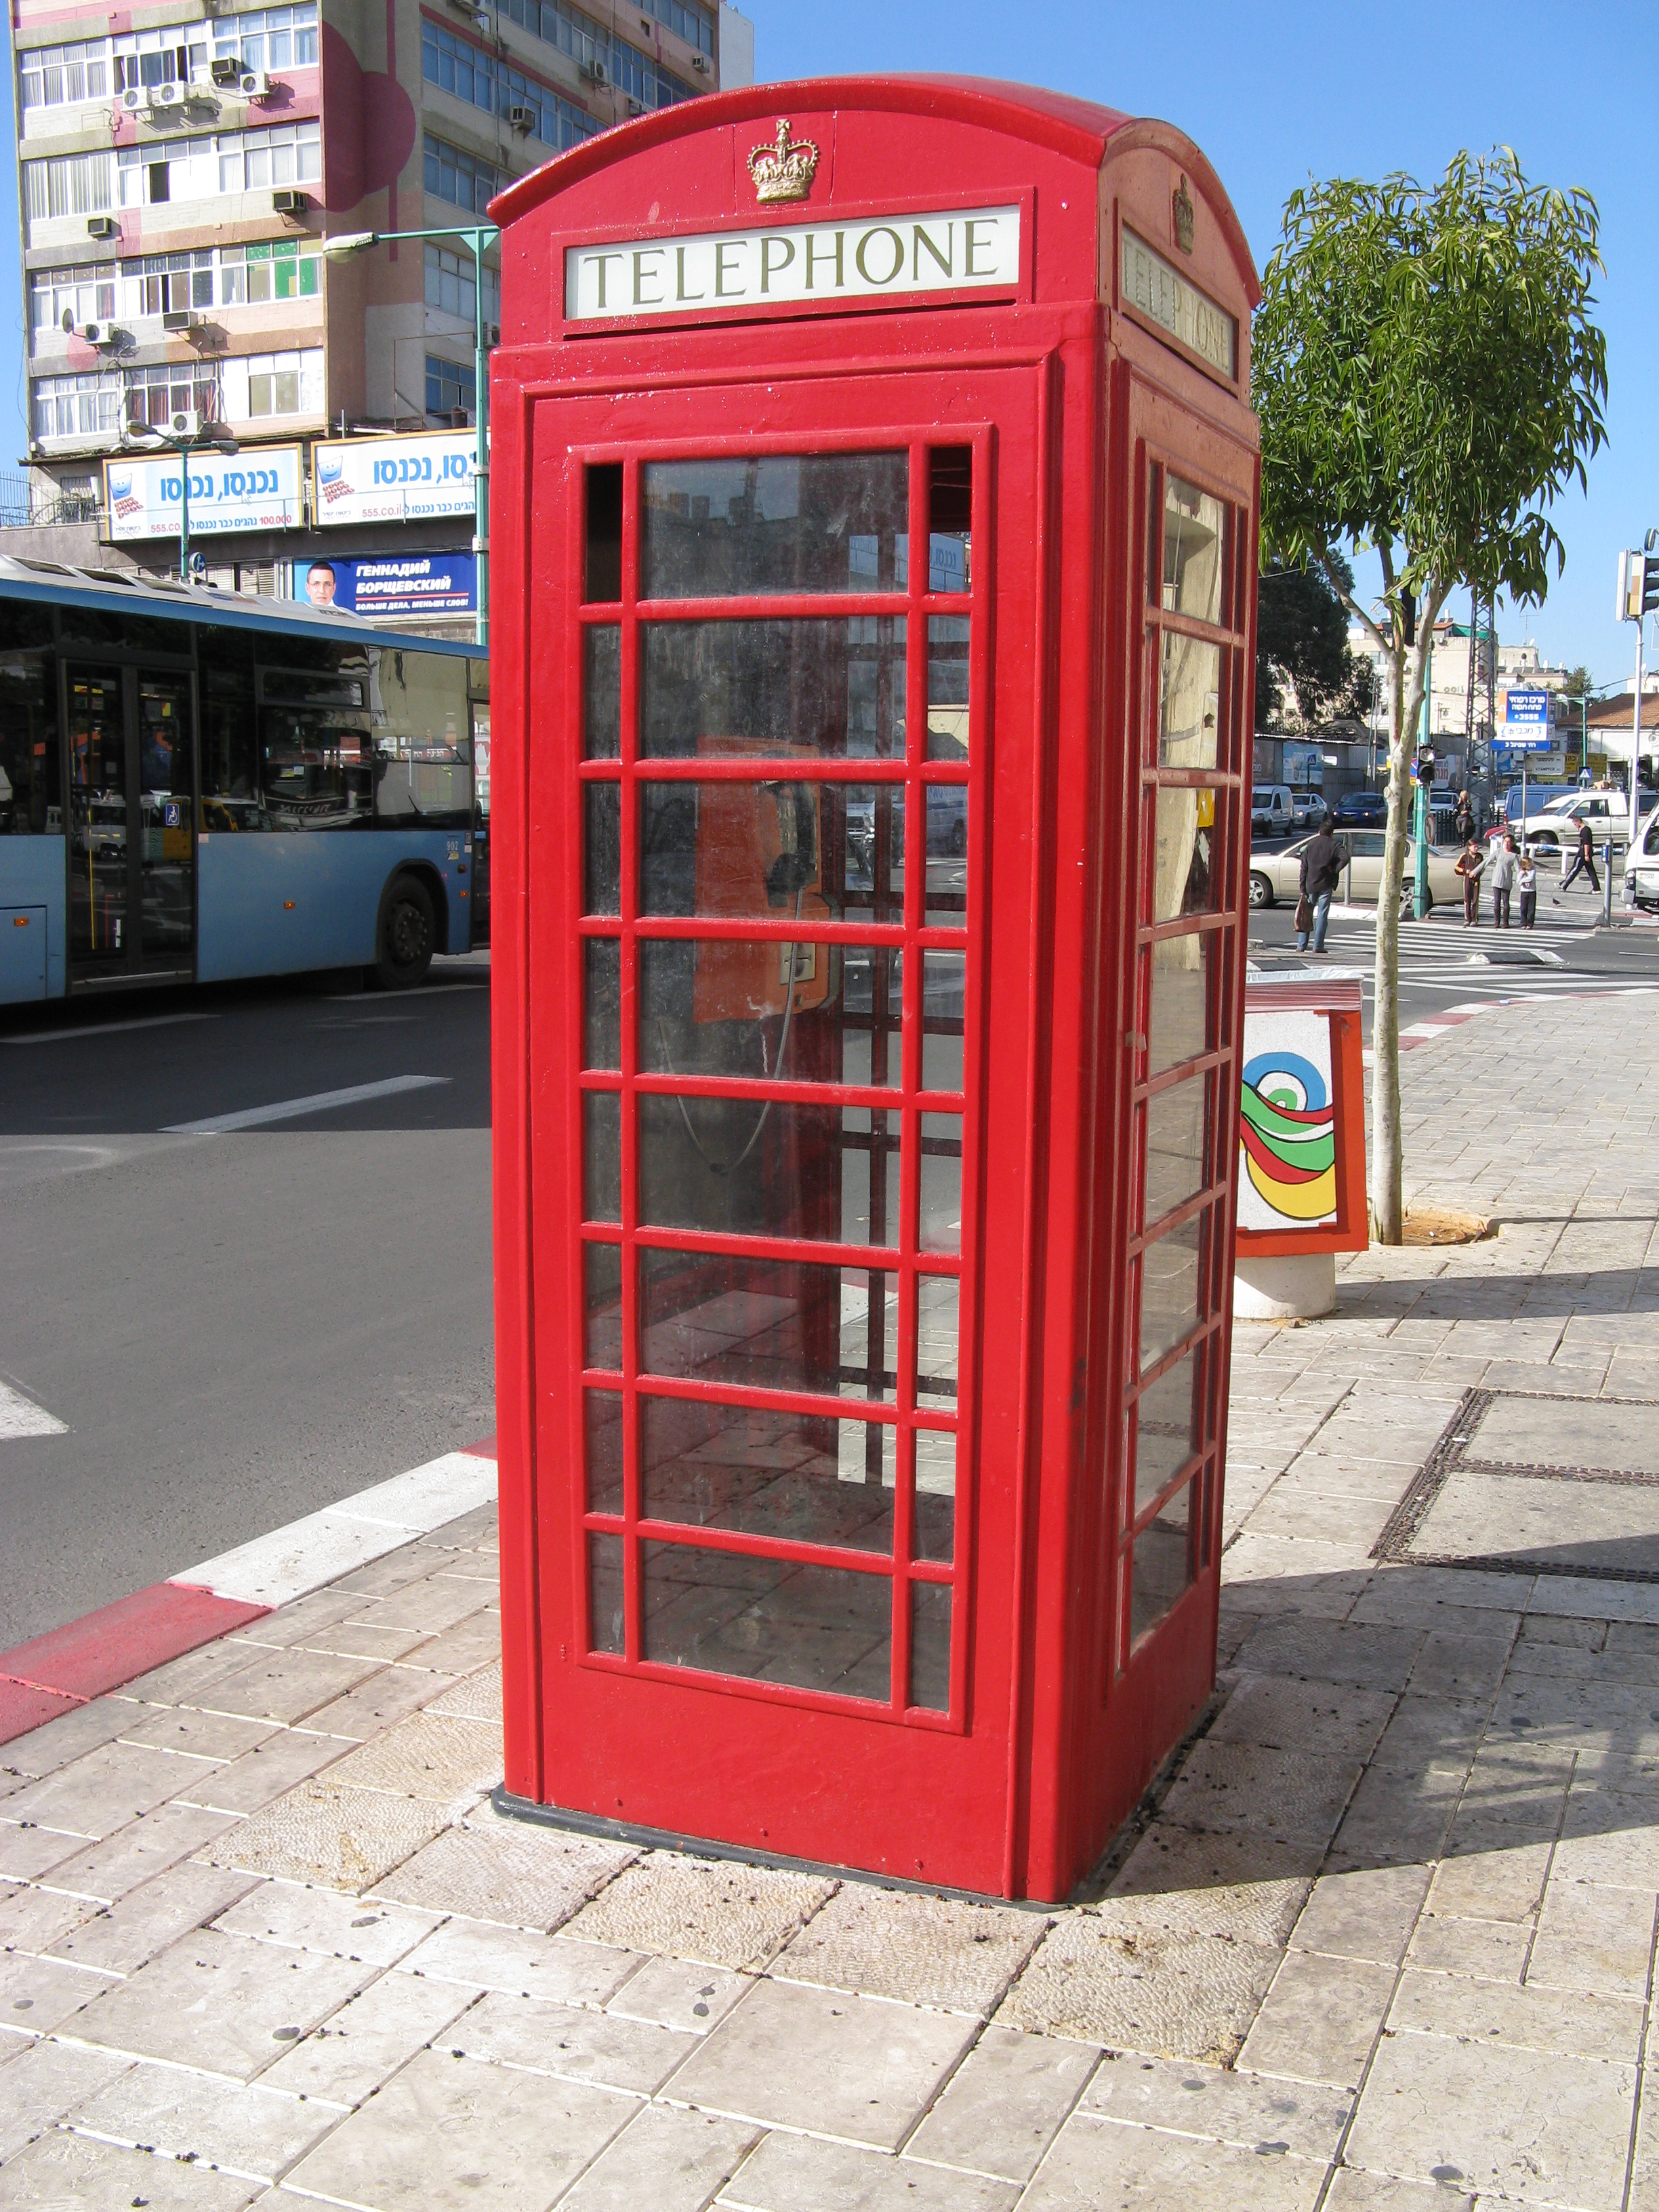
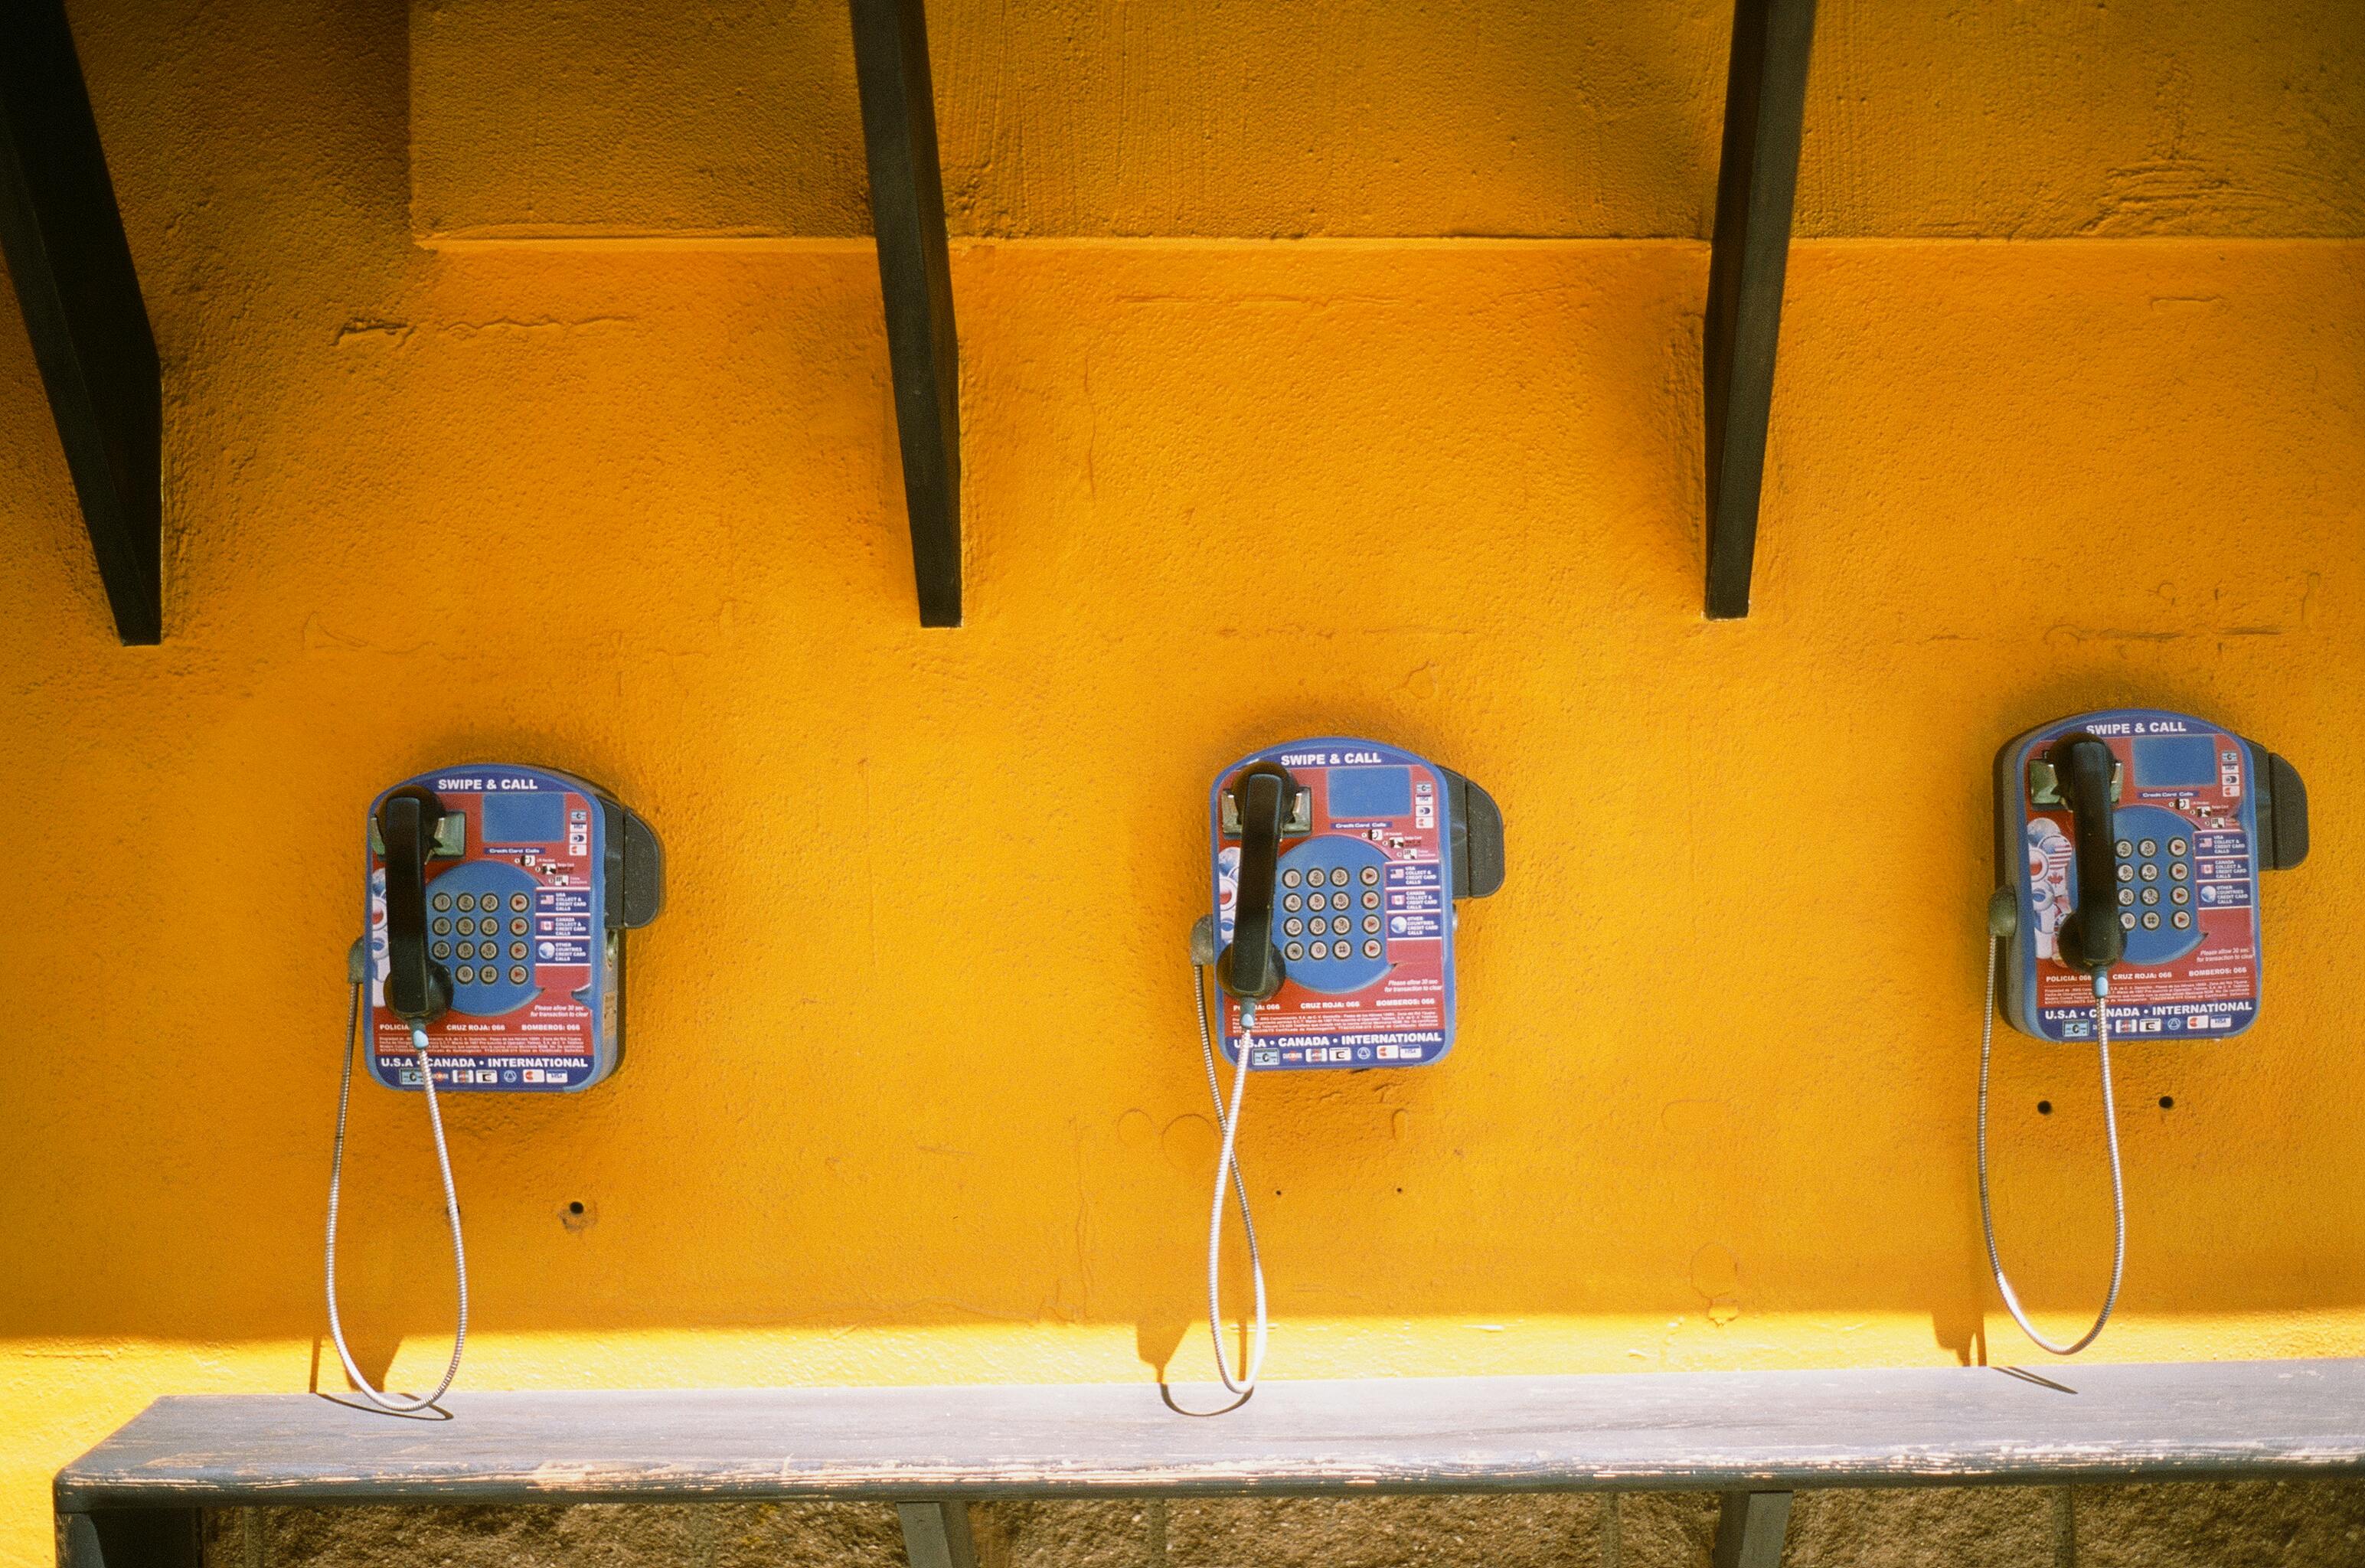
This past week I was traveling and was taken off guard when I saw a phone station. At first glance I thought this was a modern day phone booth. I looked for the phone, credit card reader, directions and buttons but couldn’t find anything. I actually looked a bit closer at the parts. There were only two. There was a small partition and place to put your phone as you speak with people. After a few weird looks from commuters I concluded this was a modern day phone station/booth.
It had me thinking of how the phone booth has evolved over time. It had a purpose back in the past and seems it still has one now.
Examples of how products have evolved over time can be found just about everywhere. This can be true for products as well as strategies/processes.
I believe the same can be said about instruction in schools. New research can impact the strategies that teachers use in the classroom. These strategies have also evolved over time. Marzano and Hattie are just two names out of many that have impacted the field of instruction and teaching strategies. Some strategies have been proven to be more efficient than others. Books, articles, administrators, coaches and other professionals often impact what new techniques educators utilize. How students respond to those strategies is important. Some of the strategies I used when I first started teaching continue to work and others were cut after the first year. Educators reevaluate tools and techniques in their classroom. I believe this reevaluation is a form of evolution that comes with experience and betters teachers and their students over time. Some of the strategies that I use stay the same from year to year while others change. I question some of the tools and strategies that are used or given to me. Are they efficient? Do they provide opportunities for students to make meaning? Is this the best strategy for my students? Educators often adapt and evolve their teaching strategies to meet their students’ needs. Teachers evolve over time and this is a driving force that can impact students for the better.
My fifth graders started off the week learning more about fractions. On Monday students used a visual model to multiply mixed numbers. The visual model was a bit challenging for students to grasp. Many of the students knew parts of a multiplication algorithm, but not necessarily how to show the computation visually.
It took a decent amount of modeling and experimenting, but I believe completing the visual models increased students’ understanding of fraction computation. After a decent dose of the visual model, students were introduced to a fraction multiplication algorithm. I tried to make the connections between the algorithm and visual model as apparent as possible. Many students made the connections, but not all.
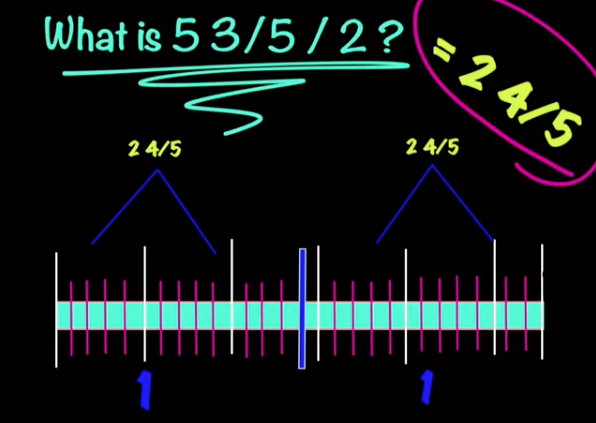
Around mid-week students started to divide fractions. Again, I started off the discussion around using a visual model to show the division.
This time students were more confident in creating the visual models, although some wanted to jump to the standard algorithm. This stopped once I included the visual model as part of the steps required to solve the problem. Some of the students that had trouble creating the visual model for fraction multiplication started to become more comfortable with the division model. This was good news. The most challenging part for my students was finding a fraction of fractional pieces.
This was solved once students realized that “of” meant to multiply and then they were able to find a solution. The class had many light-bulb moments as students made connections between the visual model and standard algorithm. Also, one of the additional benefits was observing students look at the reasonableness of their answers. This was more apparent when students created a visual model first. The class will be sharing their models next week.
I’m finding that there’s power in using visual models. The opportunity to use trial-and-error with visual models has many benefits. It’s a low-risk opportunity that allows for multiple entry points. Students are making sense of fractions before moving to the standard algorithm. It might not be the most efficient way to compute fractions (as students continue to find out), but I believe students will have a better understanding when they can visualize fractional pieces and then use a process to find the solution. At some point students will be shown a visual model and be asked for the computation. I feel as though students were steadily building their conceptual understanding of fractions this week.


