My fifth grade classes started their data analysis and probability unit this week. On Monday the class had a conversation about the terms we use when discussing data. The words, likelihood, probability, experiment and chances were all discussed. After reviewing the terms we dove into the first lesson of the unit.
One of the first activities I generally use asks students to draw a card (between 1-5) 20 times. The data is supposed to be collected and then shared. The class then looks at the predicted probability compared to the actual results.
I decided to change the lesson a bit by incorporating a technology component and possibly save some time in the process. The class also just finished a pre-algebra unit and I thought the formulas used in a spreadsheet could reinforce some of the learning. I’ve had success with using Excel with my fifth grade class so I decided to use that medium for this lesson. Also, my students now all have Google Drive passwords so they’re all able to login with a Chromebook.
Earlier in the day I put together a Google Sheet with a tab for every student in the class. I shared it with all my students during our math block. Students retrieved a Chromebook, logged in and found the shared document. I modeled the formula within Sheets and the students followed along.
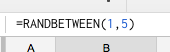
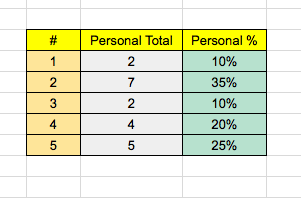
Students were able to randomly select the digits between 1-5. Students observed their data and how it changed. We had a classroom discussion on how the sample that they created was based only on 20 trials. They were then able to observe their personal total.

After reviewing their total, they could view the tab called data set. This showcased the data of the entire class. The total, over 300, was much closer to the predicted results.

After students compared the two they filled out a writing prompt asking them. to compare their individual results to the class. What were the similarities or differences? How does a larger data set impact reliability? Students wrote down their responses. I’m in the midst of grading those right now.
The activity was great, but also had some issues. Getting everybody to stick to their individual tab took some work. Some students were caught viewing other students’ tabs. Also, the data sets kept changing when someone clicked certain cells. This was tedious near the beginning. Regardless, once those two kinks were taken care of it was smooth sailing. I ended up freezing some of the cells so students couldn’t change them.
At some point the class will revisit the spreadsheet to discuss tree diagrams. Click the image to copy and use the spreadsheet in your own class.

I changed the names to S1, S2 … so you can change them as needed.

One thought on “Random Numbers and Sheets”