
During the past few months I’ve had a chance to explore Desmos. I started seeing the platform on Twitter a while back through different educational chats. It was prevalent in #msmathchat as well as in the EduTwitter math world. I saw it across my screen, but didn’t really dig into how it could be used until NCTM. During that time I attended a session titled “Which Comes First: The Equation or the Functions? Come Stack Cups and Use Demos to Find Out!” The session was presented by the University of California staff.
The session started out by having the participants sit in groups with a stack of styrofoam cups. We were asked the question below.

My table took the cups and started stacking them. They found the measurement of one of the cups and decided to use millimeters to be more accurate. We came to a consensus and decided to extend the pattern and graph our pattern. The presenters then asked us to head to a Desmos url where we could plug in our numbers. The audience filled out this step-by-step sheet for the next 20-30 minutes. Being a newbie to Desmos, I appreciated how the sheet guided us through the different components of Desmos and how it graphs the line as the numbers change. The sheet also includes teacher directions that I found useful as I replicated this exact lesson a couple weeks after NCTM.
The second part of the session went in a different direction.

Basically, we were asked to find out the option that would give us the most money during the next 14 months. My table filled out this sheet and used this Desmos template to find a solution. There was a lot of trial-and-error during this time and some perseverance, but it was a worthwhile journey. Listening to others at my table was enlightening. Hearing how other teachers, mostly at the middle and high school levels, gave me a different perspective. Being able to find patterns and develop algebraic reasoning was at the forefront. Using Desmos to create or check our predictions was helpful. Moreover, I was able to learn more about the Desmos platform and how it could be used in my classroom.
Near the end of the session I started gathering all the links to save for later. I started to think about how this could be used in my own classroom. I began by using a few different tasks with my sixth grade standards. The inequality activities were very helpful as I was becoming more familiar with the logistics of using Desmos in the classroom. Desmos isn’t a math tool that’s used frequently in elementary schools. The calculator included can be intimidating for elementary students as well the teachers. Although, when my class first started using the platform my students were totally interested in wondering what all the symbols meant on the calculator.
During NCTM I was fortunate enough to come across Annie’s post on how to use Desmos in the elementary classroom. I reviewed all of Annie’s examples and decided to graduate and move on to creating my own. I started with copying a couple card sorts for a kindergarten and first grade group that I see four times a week. The sort included having students put together base-ten blocks, written names, standard form, and expanded form statements. The lesson went well and I had to intensely model how to login and ended up using a QR code for students to access the url on an iPad.
I then started getting used to how to create better questions using “what do you notice” or “what do you wonder” types of prompts. About three weeks ago my third grade students needed to review polygons and relationships. I decided to put together an original activity.

I ended up making the shapes in Illustrator and inserted them into the activity. I used this task with a third grade group of students that were working on fourth grade standards. Students worked in pairs as I didn’t have enough Chromebooks and iPads for everyone that day. I used the pacing function and made sure all the students were on the first slide. I love that Desmos includes that function as many of my students want to speed through an activity. Stopping with “pause” to review all the different responses was also helpful. This helped encourage a class discussion.
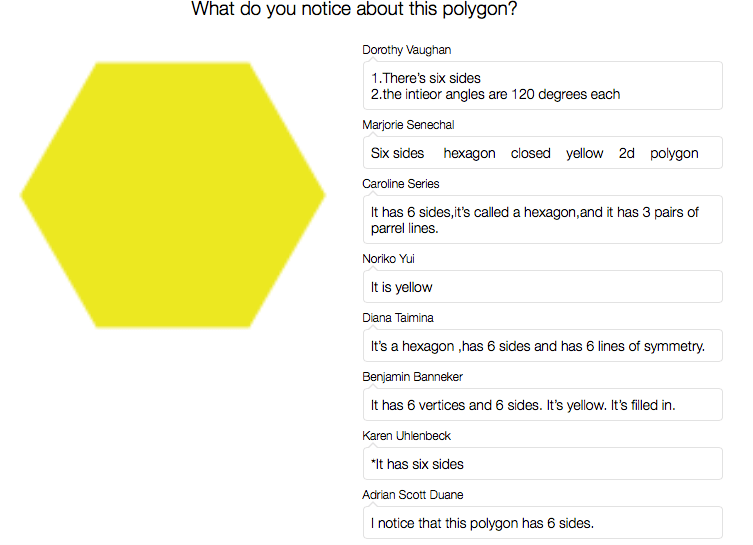
At first I used the “anonymize” option, but soon found that students wanted to be identified. Students used a similar prompt with a trapezoid and triangle. I then went over a few different vocabulary terms before heading to the next slide.

Students checked off the criteria that matched the shape. I then displayed the correct solution and this led to additional questions and conversations. When creating this I decided to look back at some of the most engaging Demos activities that I’ve used. Most of them ended with some type of card sort. I decided to do the same.
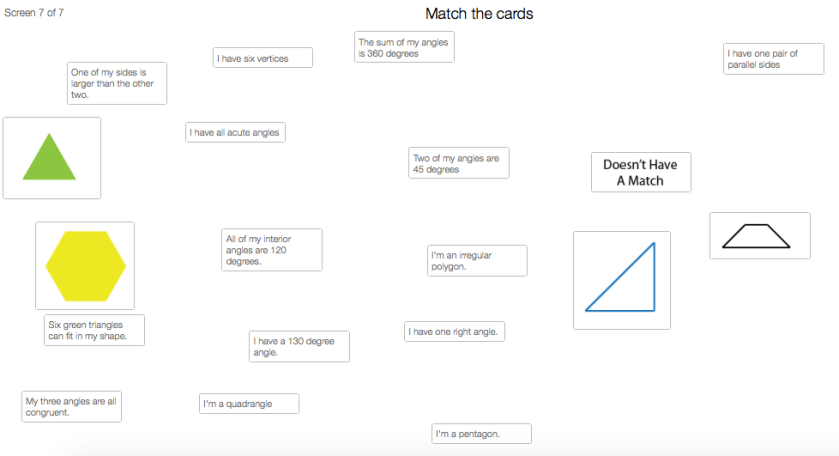
I decided to have a “doesn’t have a match” column to increase students thinking. It took a while for students to complete this as certain criteria worked with only one shape while other statements didn’t match any. When I first created this I noticed that some of the statements that were created matched multiple shapes. Ooops. It was fixed before I gave it to my third graders, but that could’ve caused a few issues. After around 10 minutes we review the answers as a class.
 Students self-checked their work to see how accurate they were. Some students didn’t actually match the statements completely. They brought the statement to the column, but didn’t attach them. I should’ve explained how to do this before completing the activity. This happened with around three students. The next time we completed an Desmos activity those students were fine and attached the statements. There’s a small learning curve with these types of activities and this was one of those moments.
My next step is to learn how about the computation layer and possibly how to use it more effectively with my K-3 students. I think it’d be great to be able to rotate or drag a shape on a coordinate grid. Students could then use a digital protractor to measure the internal and external angles. I’m also looking at how to use polygraphs more effectively next year. My students had a blast using them during the last week of school. Maybe I’ll learn about that during the summer. I’m looking forward to using this more with my elementary students next school year.
