Last night I was fortunate to attend ICTM’s chat on feedback. It was a productive chat and Anne had some great questions cued up for us. I came away with a few new tools that I need to research. Chats like these are motivating as the frigid cold of the midwest is ever-present this time of the year and new ideas can spark my planning process.
Teachers know that student feedback is important – it’s everywhere in schools. It’s on every teacher evaluation tool that I’ve experienced. ASCD describes it as “Basically, feedback is information about how we are doing in our efforts to reach a goal.” Teachers give feedback all the time – most without even labeling it specifically as feedback.
The chat was still on my mind this morning as my colleagues and I were having a conversation about math units. After reviewing multiple student papers, I started thinking about feedback in more detail. Specifically, I started thinking about how feedback takes on different forms and the tools that are used to give that feedback can vary from class to class. In all cases that I’ve come across, educators want students to actually USE the feedback.
Technology can be used for this although the reliability of the feedback might not match the need. I’ve also seen cases where the automated feedback is disregarded by students in an effort to score more points. It depends on what’s needed. In some cases, a quick verbal prompt might be the feedback that’s needed. For others, a conversation with a partner can help students identify misconceptions or spur thought.
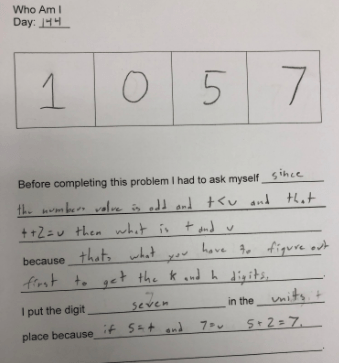
Let’s take this problem:

This particular students was able to identify the rule and complete everything but the bottom problem. Being able to anticipate misconceptions can lead to better student feedback. There are a few questions that I might have before approaching the student and giving feedback.
- How can this student divide 14 by 7, but still have trouble with the bottom problem?
- Does this student think of “divide by two” as half of the in?
- Was this a simple mistake?
Or here’s another one:
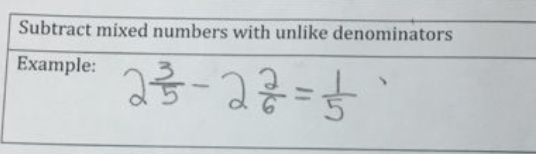
- I notice that there isn’t any work or model here
- Did the student notice that the denominators weren’t equal?
- What strategy was used here?
- Was this a simple mistake?
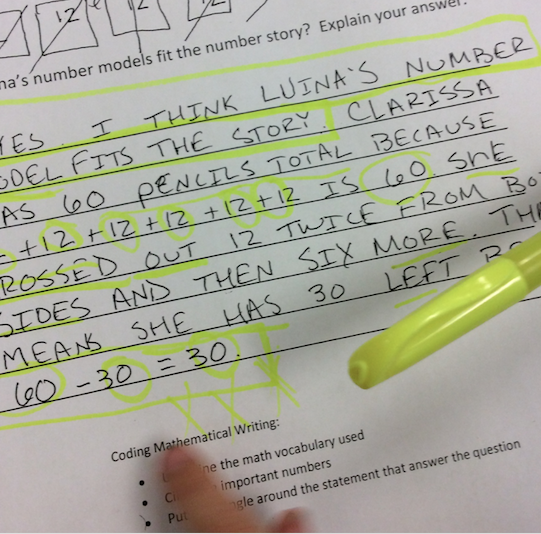
Last one:

- Did the student miscount the boxes?
- Is the students missing pieces? (yes, this has happened before)
- How did the student get 6 as the numerator?
In all of these cases a simple mistake is probable. I’m working with K-6th grade math this year and sometimes rushing leads to simple mistakes. I try (as much as I can) to limit that option when deciding to give feedback. In all three of the cases I could ask the student to recheck their work. Some students will, while others won’t. I could also write on their paper a statement or question about wondering what strategy they used. I could also have the students meet with a peer and discuss the problem in more detail.
There are so many ways to communicate feedback and it’s not a simple issue. Some students are more responsive to written feedback, while other students want to have a conversation with another peer to discuss their strategies. As students get older the type of feedback also changes. Many of my upper elementary students prefer a brief comment on a paper or a quick underline, question mark, or specific arrow to help them move towards a goal. Having a 1:1 feedback conversation with a student is my number one option because then I can see how receptive they are and answer any follow-up questions. If you don’t have time to do that with every kid (who does?) then you use other options.
There are a ton (I mean a TON) of apps out there that “help” students along their math learning journey. I tend to be a bit caution when deciding to use them in the classroom. Is the feedback appropriate for their needs? Is the feedback helping them in their efforts to reach a goal? In some cases it may, but I think it’s worthwhile consider the ways in which feedback is given.