
My fourth graders are just about finished with their unit on geometry and measurement. They classified angles earlier in the week and are now looking at angle relationships. This is one of my favorite topics to teach as it involves logic and an understanding of basic geometry. I’m finding that students are becoming better at measuring angles using a protractor. Using Angle Tangle has helped in that process. They’re able to identify and measure acute and obtuse angles comfortably. Reflex angles still give them issues, although this is improving as students are able to subtract an acute or obtuse angle from 360 to find the measurement.
Students then moved on to angle relationship skills. When asked to find the missing angle in a triangle they immediately started to look for their protractor. Students wanted to find the actual measurement without looking at what types of relationships actually exist and if a protractor is needed. So on Tuesday the class reviewed interior angles. Students found through patterns that they could split a convex polygon into triangles and find the sum of angles. This was eye-opening for some students and you could tell that they were relieved in seeing that they wouldn’t have to measure all of the interior angles.
One of the assignments called students to create polygon and find the sum of angles without actually measuring each interior angle. Some students were stumped while others students looked at how a triangle’s sum can aid in finding the sum of other polygons. The student projects turned out well, although some had to redo them as the drawing actually started to get in the way of creating triangles. This is one of the better projects.

I could tell that students needed a bit more practice with using angle relationships to their advantage. On Thursday I asked students to create a qudrilateral using a straightedge. Students drew arcs to indicate the angles on each vertex. The quadrilaterals were cut out and the sides of the shape were torn off. Students lined up the sides and the class had a brief discussion on what they noticed.
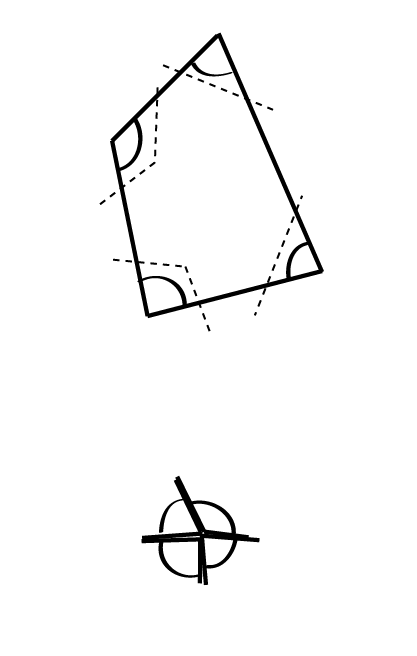
Right away, some students noticed that the arcs didn’t line up. They also noticed that the four corners actually created a circle. Some even said that the total was 360 degrees. Students checked their work by using a compass to add all of the angles together. Their prediction rang true. This was a winning moment as I could tell that students were starting to grasp this concept better. I gave each student some tape and they tapped together their circle to their folder. I’m hoping it stays on their folder and in their memory banks.


