This summer I’ve had opportunities to review math units that I’ll be teaching in September. I’ve been beefing up the units with formative assessments and intentional questions that focus on math reasoning. One skill that seems to need bolstering every year falls in the category of proportional reasoning. This becomes quite evident when students encounter fractions and rates. Some students may use proportional reasoning,but it’s not necessarily identified as a strategy or communicated using that specific vocabulary.
I also picked up this book over the summer. I read it about a year ago, but I’m finding so many gems in there a second time around. The authors reveal research that indicates teaching proportional reasoning has benefits. The authors also showcase that proportional reasoning is difficult to define, but they can categorize what people can do with this type of reasoning. People that use proportional reasoning understand the relationships that numbers have put together and how they relate individually. They can analyze numbers and look the difference (additive) between them and observe the ratio (multiplicative).
My takeaway from this section of the book comes from the authors’ five reminders. These reminders come in handy when thinking of how to create learning experiences involving proportional reasoning.
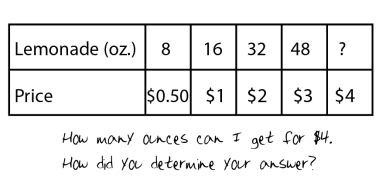
1.) Use unit and multiplicative models. Double-down on using the idea of a rates, which can be applied to the idea of a proportion. Specifically, I can think of rate tables to be helpful with this.
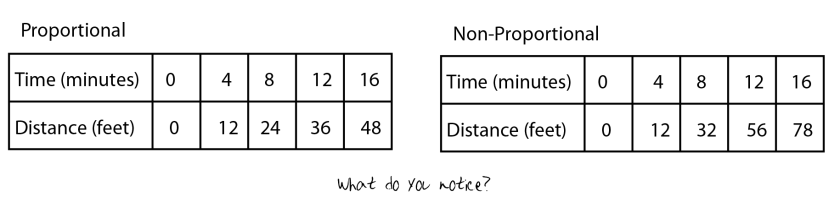
2.) Identify proportional and non-proportional comparisons.
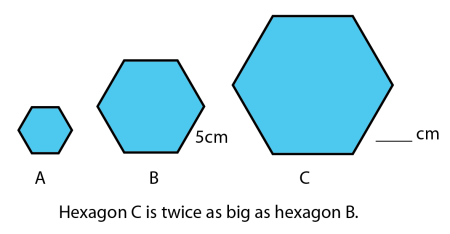
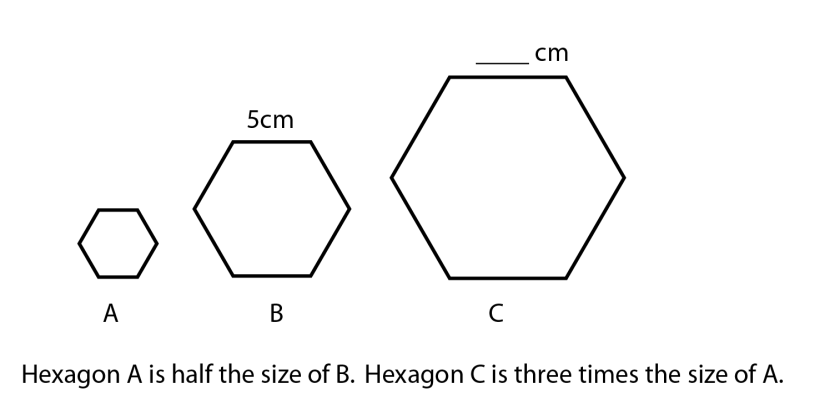
3.) Include measurement, prices, graphs, and geometry to show proportions. Proportional reasoning can be found in a variety of contexts.
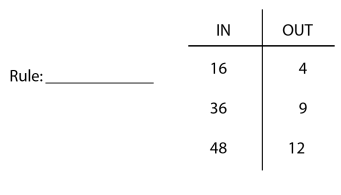
 4.) Solve proportions using different strategies. Focus on reasoning. This may be ignited by planting questions that elicit different ways to solve the problem. Students should be able to compare and discuss what comparisons exist. This can also be addressed through the use of “what’s my rule” tables.
5.) Have students recognize that short-cut methods such as cross-multiplication aren’t helpful in developing reasoning.
Being able to identify proportional reasoning can help teachers emphasize its usefulness. Having in-depth conversations about this type of reasoning has benefits. I realize that this post is heavy on tables and that’s not the only form that proportions take. I do feel as though the tables help students observe the relationships a bit easier since it’s organized. While exploring this topic I came across a MARS activity that I’m planning on using in September.