School officially ended around a week ago and I’m starting to look back at the year. During the last few days of school I gave students a survey. I’ve used end-of-the-year surveys before, but this year I wanted to get the students’ perspectives on lesson structure and math interactions.
The reason I went in that direction because I noticed some trends while recording myself teaching. These recording were taking place because video recording were required for a certification that I’m pursuing. I went with the volume approach and decided to record three days a week for the first couple months of school so students would feel more comfortable around the camera. At first, students would wave, make faces, dab and do all sorts of unrelated math actions around the camera. That died down once students started to see that the camera wasn’t leaving.
After reviewing many different recordings (this took what seemed like forever), I started to notice trends related to how I was designing and implementing lessons and tasks. This was a humbling experience.
I noticed that students were doing more independent work that I’d like to admit. There’s nothing wrong with independent work, but I wanted students to engage in math conversations with one another more frequently. My lessons weren’t generally designed to have these math conversations occur regularly. I used quite a bit of whole-group math conversations to spur mathematical thinking. Although that seemed to be a good use of time, I noticed that not everyone was engaged. There were students that hung out in the background and didn’t engage unless called upon. I found through this experience that I was spending too much time on certain instructional elements and not enough on others. I want the time that students spend in my classroom to be valuable and useful. So I decided to start varying my strategies more often. Short story: lesson design and pacing is undervalued.
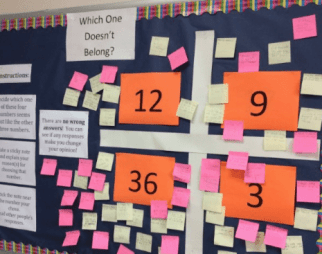
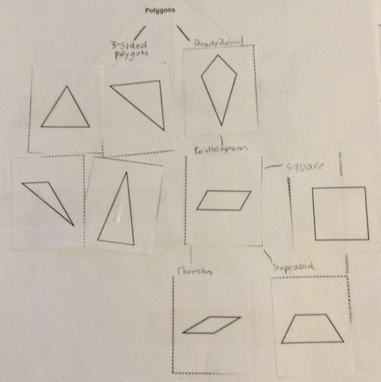
So I made a few changes related to how often students work together. The class created norms associated with how students should be working with one another. I decided to increase that amount of “collaboration” so that each class had more of the time dedicated to working with other students. I used visible-grouping strategies so students could see that groups were randomly chosen and all ideas are valued. During this partner/group time students were completing math tasks, short-term assignments, long-term projects, Scholastic magazines, Desmos, Nearpod, and Kahoot! activities. I noticed that students were having better math conversations at a more frequent pace. While students were in groups I walked around and asked questions to help ignite or guide the discussion. This slight shift seemed to play dividends as the year progressed. Students became more confident with their math communication skills and the quality of those conversations increased over time.
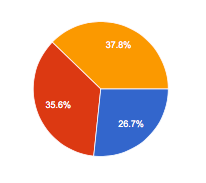
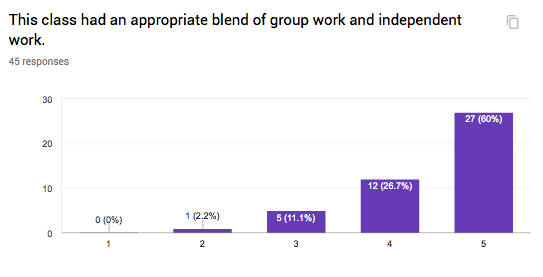
Here are the survey results that came out during the first week of June.
Not quite sure about the 2s and 3s. I reviewed what the term “appropriate” meant and how it applied to their personal learning before students answered the question. I think that some students prefer to work independently, while others thrive during group work. I have to take this into consideration while reviewing these results. Also, some students might be rating the actual work that is being done during these two scenarios.

I was pleasantly surprised to see these results. I tried to focus on giving students multiple ways to show their mathematical thinking. Looking back, I used whole-group and independent math routines, projects, journal pages, individual tasks, math reflection journals, and math class discussions throughout the year. I was hoping to give students multiple opportunities to learn about math. I believe students enjoyed some of the structures more than others, but having a variety of them gave them opportunities to see math from different perspectives.
The last survey question is below.

This has been an issue that I’ve been tackling for years. There are not simple answers for this. Students often view math as a speed game. The quicker they are, the better. I believe students see and are experiencing mixed messages when it comes to their math journey. Fortunately, I get to loop with students and they get the message that math is a journey and there’ll be challenges and wins along the way. Now what they do with that message differs. When students perceive math as a journey, they develop a deeper understanding of the concepts that are introduced in class. There’s also less anxiety related to speed and algorithms. I’m going to keep this in mind while planning out what messages are being sent to students and the community next year.


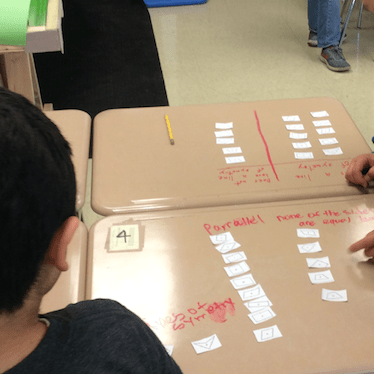
 Students self-checked their work to see how accurate they were. Some students didn’t actually match the statements completely. They brought the statement to the column, but didn’t attach them. I should’ve explained how to do this before completing the activity. This happened with around three students. The next time we completed an Desmos activity those students were fine and attached the statements. There’s a small learning curve with these types of activities and this was one of those moments.