One of my classes started a unit on fractions around two weeks ago. We explored the lowest common multiple and greatest common factor during the first week. Moving on, the class investigated the different ways to multiply fractions. Most students had an idea of how to find the products by multiplying the numerators and denominators. They struggled when using visual models and also when converting fractions to/from a mixed-number form. We spent a couple days reinforcing how to visualize fraction multiplication and created multiple models to show how to multiply a fraction of a fraction. We used the folding paper method as well as free-hand drawing of different models. On Thursday, the class moved to the next topic: fraction division.
I’d say that this is a topic that’s a bit confusing every year. Many students, and I mean almost a third of my class tend to come into the class with an understanding that when you divide, the quotient will always be less. This is one of the tricks that expire. So, as I started to plan out what I was going to do during the introduction, I had to keep in mind that this topic has the potential to be a misconception minefield.
On Friday, that class started to study the topic of fraction division. I ended up using a Brian’s amazing resource to put together a Nearpod activity involving fraction division. Without discussing the topic too much, I asked students this question:
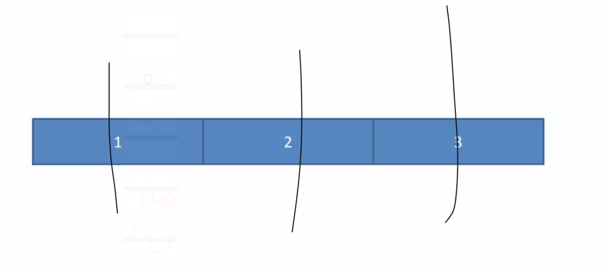
Show 3 ÷ 1/2. Write on the picture to show your model.

Students worked in pairs with one device to find a solution. Some groups immediately started splitting up the fractions. The confidence from these groups seemed to be high. Other groups were discussing what was meant by the visual model. Here is one of the initial responses:

It was interesting as some students wanted to split the entire three sections in half. This had me wondering if the students understood that each block was one whole. I also had some students that were able to find a solution, but it had to do with using the trick and not the visual model.

When pushed to explain their thinking the students weren’t able to move past the process of finding the reciprocal of the second number and multiplying. The class then moved to the second question.
Show 3 ÷ 1/3. Write on the picture to show your model.

Students seemed to be more comfortable with the problem. They were also a bit more careful when splitting up the shapes. I reinforced with the class that idea of dividing fractions. The responses showed more detail this time around.


All of the responses used some type of a visual model, which was a positive as this didn’t happen as much the first time. When asked to explain their reasoning, students were able to tell me with confidence why the model made sense. Also, some of the students started to find that that they could check their answer with multiplication – 3 ÷ 1/3 = x , then x * 1/3 = 3. There were still students that went to a default of using the trick to find the quotient. The third problem was designed to see if students could stretch their understanding.
Show 3 ÷ 2/3. Write on the picture to show your model.

Students took more time with this model. Most of the groups started to divide each whole into thirds. That’s when trouble started to brew. Students counted up the wholes, but noticed that parts were still missing. There were a lot of questions here. I asked students to take a risk and put their mathematical thinking out there so we can all analyze the responses. The students submitted their ideas and I noticed that the answers were all over the place.


The class noticed that all of the groups split up each whole into thirds. The groups also shaded in or indicated two thirds of the whole. Students also noticed that some of the third shapes weren’t included in the quotient. There was a class debate on whether those thirds should be included. Most of the students agreed and said that they’re part of the whole so they should be included. This last question took up the most time and I think it was one of the better moments of the lesson.
There was only around ten minutes of class left, so students went back to their seats to work on a few more fraction division application problems. The struggle and perseverance to understand was evident and I’d like to find ways to incorporate this type of instructional routine more often.
Overall, I thought this lesson went well. I recorded the entire lesson for my NBCT video, so it’ll be interesting to see how it turns out. While watching the videos that I record I tend to remember instances where I could’ve done things differently. In some of the cases, I could’ve asked better questions or model a bit less and have students make the connections themselves. It’s a balance though. I’d say that watching a video of myself teaching is a humbling experience. It’s humbling, but the personal reflections that come out of those experiences are worthwhile. I think I could write an entire blogpost on that reflection process. Maybe next time.


