Graphing with Context

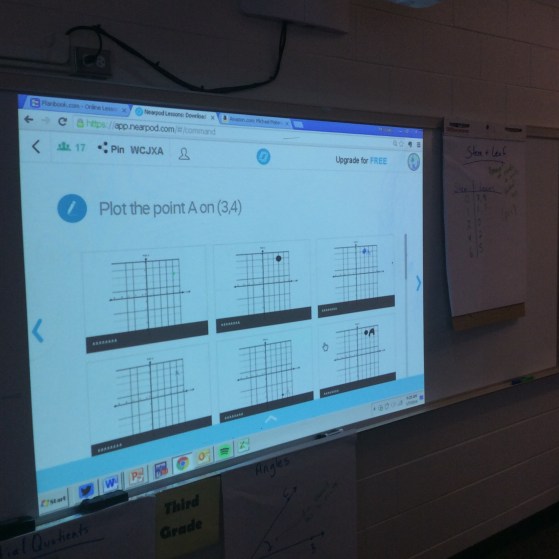
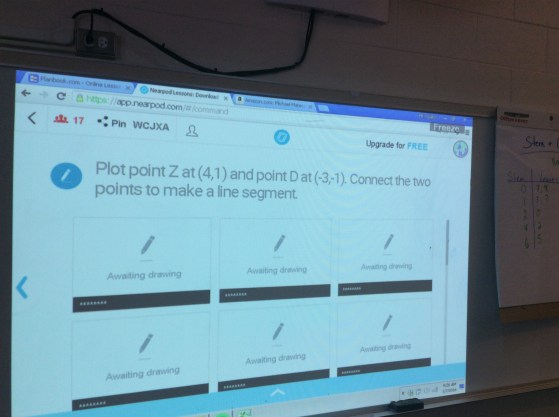
This week one of my classes has been studying coordinate grids and graphing. They’ve learned about coordinates, using a table, identifying rules and created ordered pairs during the last part of March. On Monday the class reviewed line graphs and change over time. At this point in time the class is identifying the informal slope (without a formulas) of a graph and describe events that are taking place by analyzing the relationship between the x and y-axis. Earlier this week my students worked through Kurt’s Retro Desmos solving systems by graphing task.

I selected specific slides to complete as the class hasn’t been introduced to the y-intercept yet. The class spent a good chunk of time on slide four – a class favorite. Students tried out different strategies to see what happens as the lines cross or increase in steepness. This led to a class discussion about the slope of the line and what the x and y-axis means in context. A number of students experimented with what happens when you make multiple lines on the graph. This slide caused students to think about the context first and then how the lines look second. Near the end of the class students mentioned that they’d be interested in the process of finding the rate or speed of each character as time progresses.

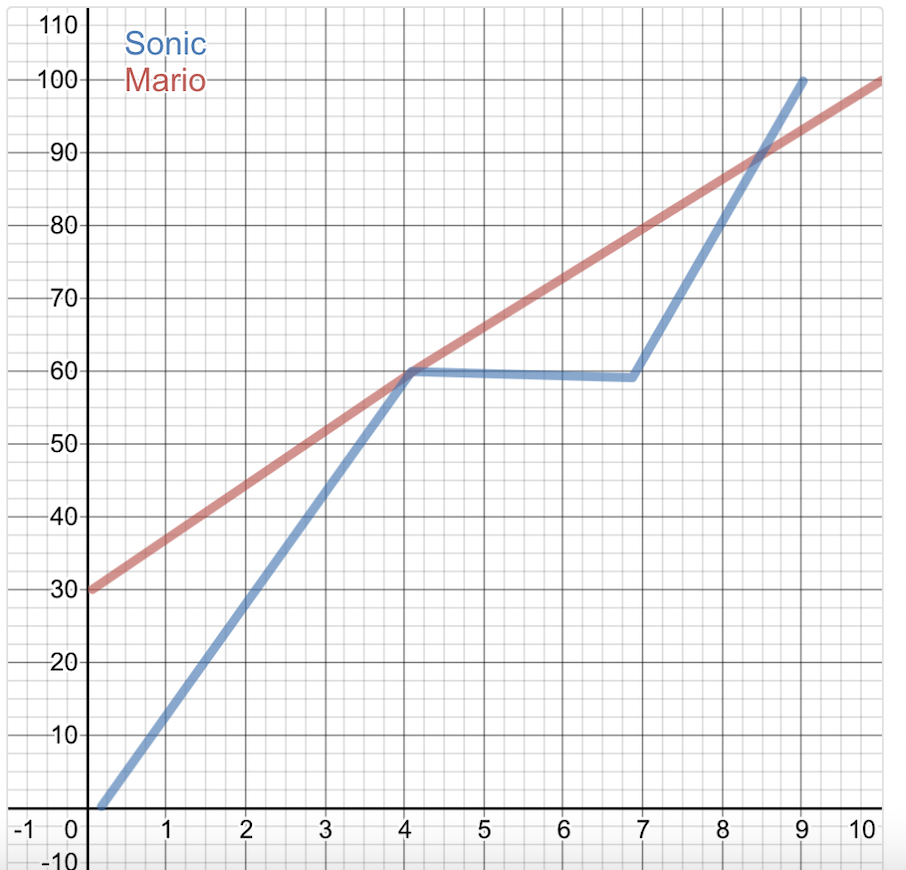
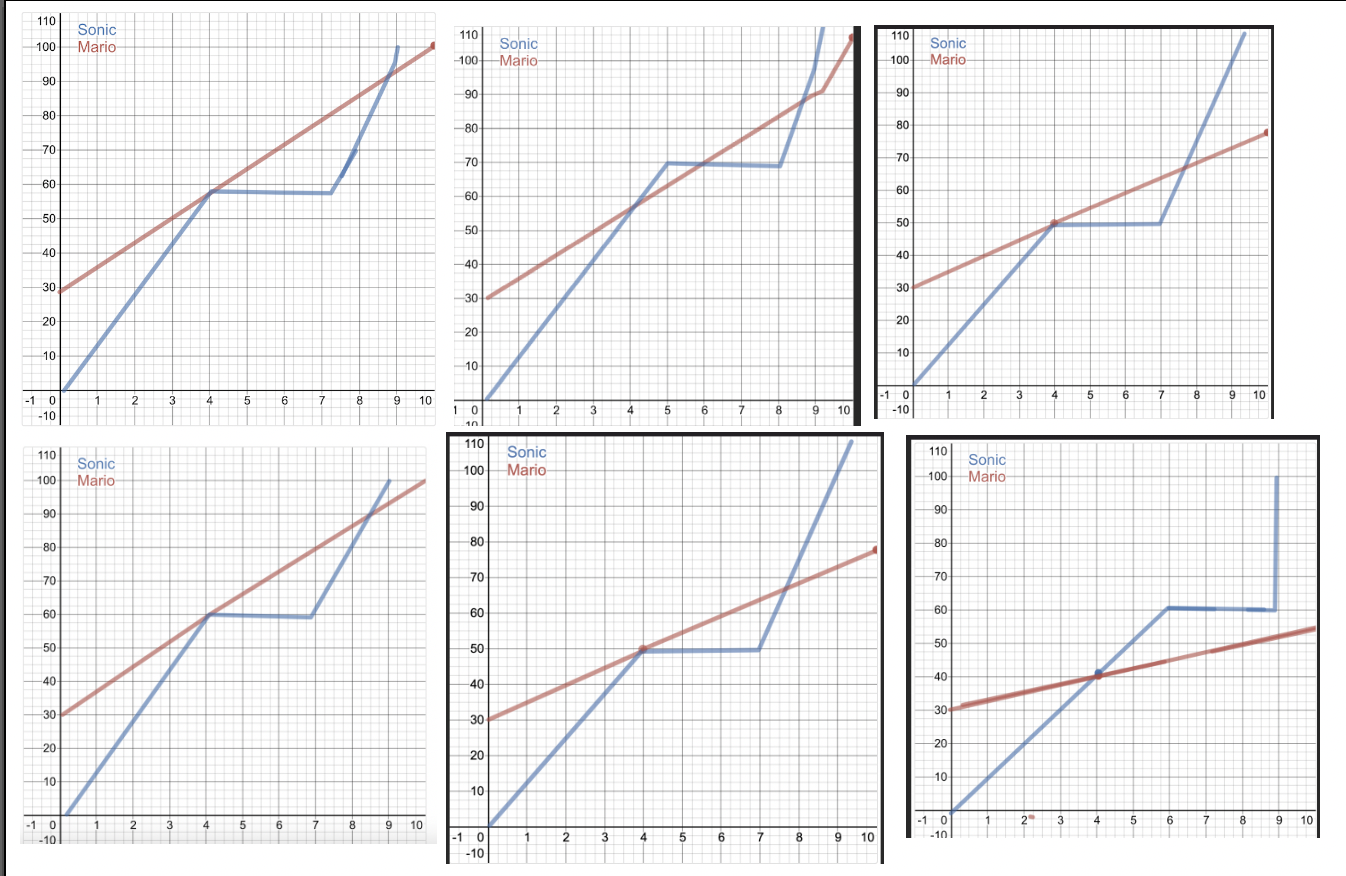
During the next class I used Kurt’s slides and idea to create an assignment. I added a few criteria pieces related to the 100 meter dash. Some of ideas were taken straight out of the original activity. Click here for the Desmos assignment slide.

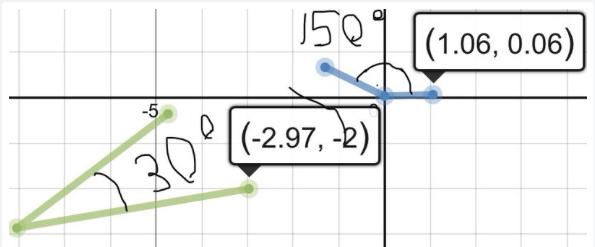
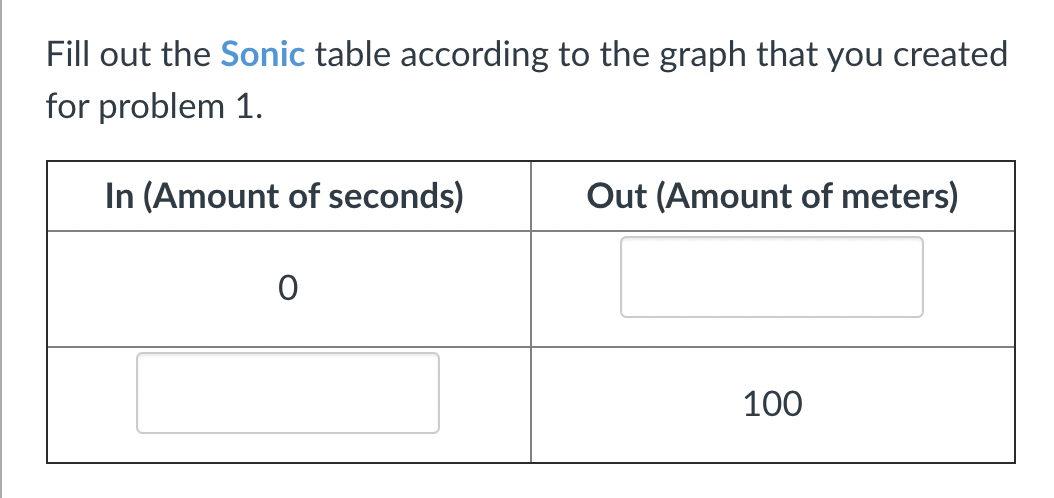
Criteria: Mario starts 30 meters ahead, Sonic and Mario are tied at 4 seconds, Sonic takes a 3 second break, and Sonic wins at 9 seconds.

Students worked on this assignment in class and checked their work by pressing play. I was impressed with how students made multiple attempts in trying to meet the criteria. The video playback of the race was used as a self-checking mechanism.

Students then answered a question related to Sonic’s line.

Tomorrow the class will review the graphs in more detail. I’m looking forward to diving into more graphing fun tomorrow.

Coordinate Grids and Houses

Screen Shot 2017-12-16 at 6.40.47 PM.png

My fourth graders just ended a unit on decimals and coordinate grids.  The unit lasted about a month and a test is scheduled for next week.  This unit was packed with quite a bit of review, decimal computation and coordinate grids.  Students were able to play Hidden Treasures, use a 1,000 base-ten block (first time they’ve seen this), and create polygons using points.  One of the tasks that stands out to me for this unit involved a coordinate grid problem.  The problem caused the majority of my class to struggle. It was a great learning experience.  Many students thought they knew the answer initially, but then had to retrace their steps.  I modified the questions a bit from the resource that I used in the classroom. Here are the directions:

Screen Shot 2017-12-16 at 6.44.35 PM.png


So, many students read this and thought twice as wide meaning they’d have to multiple the width by two.  Even without looking at the diagram they assumed that this was going to be a multiplication problem involving two numbers.  Below the directions came the house and grid

Screen Shot 2017-12-16 at 4.02.09 PM.png

Even after seeing the diagram, students were fairly sure that they just needed to multiply the width (4) by two.  When digging a bit deeper into what they were thinking I found that students were looking at the height where the roof started (0,4).  Many were absolutely certain that 8 was the correct answer.  I had the students think about the direction and discuss in their table groups what strategy and solution makes sense.  Students had about 3-5 minutes to discuss their idea.  Students reread the directions and then started to gravitate their attention to “as it is” high and then started the problem over again.

Screen Shot 2017-12-16 at 6.45.29 PM.png


As I walked around the room I heard students say:

What is the actual height?

Does the original width matter?

You have to multiply it by three?

What do you have to multiply?

This is confusing.

I’m not sure about this.

Is this a trick question?

I’ve got it!

How do you know?

I thought the conversation that students had was worthwhile.  I probably could’ve spent a good 15-20 minutes on just the conversation. Fortunately, at least one person at each table starting to think that multiplying the x-coordinate by two wouldn’t work.  When I brought the class back together, I started to ask individual students how their thinking has changed.  Some students were still unsure of what to do.  I brought the class back to the directions and then more students started to make connections.  Eventually, one students mentioned that because the height is six, the width has to be double that, which is 12.  Another student mentioned that the x-coordinate needs to be multiplied by three to equal 12.  More students started to nod their heads in agreement.  The class then moved to the next part of the task.

Screen Shot 2017-12-16 at 4.17.01 PM

Students said that we should write down “multiply the width by three.”  I wanted students to be more specific with this, so I asked the students if that meant that you could multiply and part of the width by three.  The students disagreed.  A few students mentioned that you need to multiply four by three and that could be the rule.  Again, I went back to the directions, which asked students to create a rule.  After more discussion, the class decided that you needed to multiply the x-coordinate by 3.   Students were then asked to fill out a table to show what the new drawing would look like.

Screen Shot 2017-12-16 at 6.20.41 PM.png

Students were drawn to complete the third row above.  That made the most sense to them since the first two started with zero.  Multiplying the x-coordinate by three would create (12,0).  Most kids were on a roll then and were able to fill out the rest of the table.

On Monday the class has a test on this unit.  Even after the test I’m thinking of spending some time reviewing coordinates and having students actually re-create this house on a grid.  I believe it’ll be useful as later in the year students will start to look at transformations.  This may be a good entry point to that topic.

SaveSave

Coordinate Grids – Part Two

Screen Shot 2016-01-16 at 11.04.49 AM

Last week my students started to plot points on coordinate grids.  They were identifying different quadrants and becoming more confident with drawing shapes on the plane. While reflecting on last week’s activities I noticed a Tweet that was sent our replying to one of my blog posts.

I’m a rookie when it comes to Desmos.  Most of the stories I hear involve middle or high school students. I needed to find something that worked with my elementary kids.  So I started to research and did a little bit of exploring to see how this could be used with my third grade class.  I ended up looking up some of the templates but had a bit of trouble finding an extremely basic rookie-like coordinate plane activity for my students.  I decided to go the route of creating a template and having  students manipulate created points for a project.  Click here for the template.

I quickly found that students had no idea how to use Desmos.  I gave the students 5-10 minutes to orient themselves.  Students were asked to move the points to certain coordinates  on the grid.  As they moved the points students started noticing that the tables on the left side of the screen changed.  Students started connecting how the tables changed and this helped reinforce concepts learned last week.  After this introduction time, students were given a rubric that contained the following:

  • Move the points on the grid to create two angles
  • The angles need be located in two different quadrants
  • The angles need to be acute and obtuse with arcs located in each one
  • Indicate the measurement of each angle

Students were then given 15-20 minutes to create their projects.

Screen Shot 2016-01-16 at 10.37.39 AM

Students created their angles by moving the points around the grid.  Students then shared their projects with the class.

Screen Shot 2016-01-16 at 10.44.32 AM

Students took a screenshot and then added the degree measurements to the angles.  The class reviewed the projects and students explained how they plotted the points.  This project seemed to help students make the connection between points and the x and y-coordinates.  It also reinforced skills related to angle classification and measurements.  I’m looking forward to expanding on this project next week.

Exploring Coordinate Grids

Photo Jan 07, 9 16 05 AM

My third graders started to explore coordinate grids this week. For many, this was the first time that they’ve used them. Some of the students have played Battleship or some other game that involves a grids.  Playing off that background knowledge, I used a road map to show how people can find certain locations by using a coordinate grid. This made sense to some of the students but a few still were unsure of what axis was used first to determine where to plot a point.  This was a reoccurring theme throughout the lesson.

During this process I remembered a strategy that another colleague suggested a few years ago. She borrowed the idea from another teacher and it seemed to work well in her classroom. A colleague of mine used (3,2) as an example of the “go into the building” – first number (right 3) and then “go up or down the elevator” (up 2) method. I decided to use that strategy and a few more students started to grasp the process.  The next activity in the paragraphs below seemed to solidify a better understanding for the rest of the class.

Earlier in the day I created a very short Nearpod lesson involving mostly pictures of coordinate grids. I handed out a iPad to each student. Students logged in and given a picture of a grid and asked to draw and label points.

nwBSug

I then revealed the pictures to the class on the whiteboard. The names of the students were hidden so that we could analyze each response without throwing judgement lightning bolts towards a specific individual. As the class went through each picture they started to notice trends.

Photo Jan 07, 9 20 58 AM

  • Some were switching up the x and y-axis numbers
  • Some were not creating a point
  • Some were not creating a letter for the point
  • Some were confused by the negative sign in front of the numbers

Students observed these issues from the first question and grid. After a decent discussion on the above trends, the class moved towards the second grid and question. I gave the students that same amount of time and the results seemed to initially improve.

Photo Jan 07, 9 26 56 AM

Students started to become better at finding their own mistakes before submitting their creations. I used the same strategy as earlier and displayed the results to the class. There were a few that had some of the same misconceptions, but not as many. In fact, many students vocalized the class improvement since the last question. One of the evident misconceptions revolved around students having trouble plotting negative numbers on the coordinate grid. The class discussed this and completed the third question and grid. The student responses from this question were much better than the prior two. Students were starting to develop some true confidence in being able to correctly plot points on a coordinate grid. I kept a list of the trends that students noticed and will bring it out later in the unit as we’ll be revisiting coordinate grids next week.

Photo Jan 07, 9 25 57 AM

After our Nearpod lesson (which was about 15-20 minutes) students played a Kahoot on identifying points on a coordinate grid. I felt like this was helpful as students identified the points and were able to gauge their own understanding compared to the goal.

%d bloggers like this: