End of the Year Feedback


Screen Shot 2017-06-10 at 7.42.41 AM.png

My school year ended last Wednesday and I’m now getting around to looking at student survey results.  This year I decided to change up my survey and make it more detail oriented, as I wasn’t really getting enough valuable information before.  Instead of creating my own (like in the past) I came across Pernille’s gem of a survey.  I know that she teaches at a middle school, but I thought the survey would be valuable for my kids just as well.  So I basically copied all the questions into my own Google Form, created a QR code and had students scan the code to complete the survey during the last two days of school.  Students already knew their report cards grades and they were asked to place their names on the feedback survey.  This is the first time that I’ve taken the anonymity out of the equation.  In doing so, I was hoping that students would answer the questions more honestly, which I believe actually ended up being the case.  The survey took around 15-20 minutes of time and it was pleasing to actually see students put effort into this task.  I had 54 total responses.  Of course there were absences, but I thought that size wasn’t bad, seeing that I have approximately 60 kids that I see in grades 3-5 every day.

Like I do every year, I critically analyze the results.  I look at survey results as a risk, but also an opportunity to see what the kids perceive.  They don’t always communicate what they’re thinking and this is a small window-like opportunity to catch their perception.  I tend to question the results every year, but have come to peace with an understanding that I look at trends, not necessarily every number.  Like most data, I find the individual comments to be the most beneficial.  I won’t be delving into that too much here, but here are a couple key findings:

Screen Shot 2017-06-10 at 6.34.48 AM

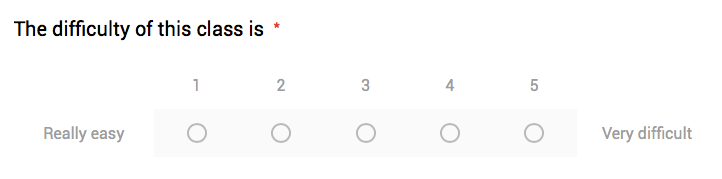
Students averaged a 3.43 for this question.  Part of me is glad that it wasn’t below three as I don’t want students to perceive the class as being light on challenge.  I want students do be able to put in effort, work hard, set goals and see that their effort has produced results.  This doesn’t always happen.  Also, the word difficulty is subjective and what someone determines as a challenge, they might not consider it difficult.  This is becoming even more evident as my school continues to embrace growth mindset philosophies.

Screen Shot 2017-06-10 at 6.34.57 AM.png

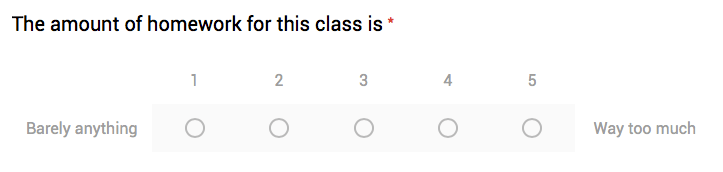
Okay, the good ole homework question.  I gave homework around 2-3 times a week and it’s used for practice/reinforcement.  Students rated this as a 2.85, which means I should be giving more, right?  Haha.  I believe students analyze this question and compare the amount of homework received in their homeroom vs. my class.  Over the years I’ve given less and less homework.  Early in my teaching career I used to give homework Monday-Friday, but have reduced that amount during the last five years.  It’s interesting to see the students’ perspective on this heavily debated subject.  Maybe next year I could add a question related to whether the homework helped reinforce concepts for students?  We’ll see.

Screen Shot 2017-06-10 at 6.35.10 AM

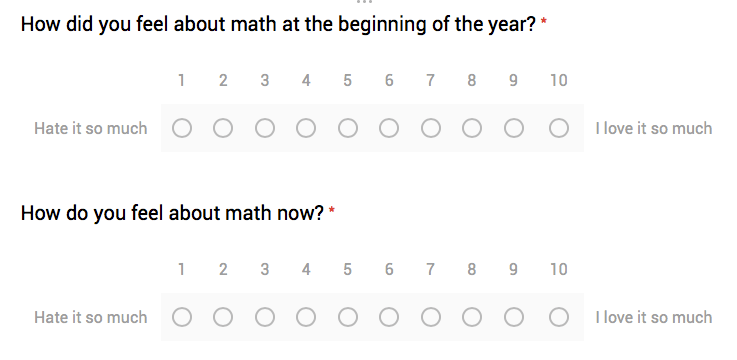
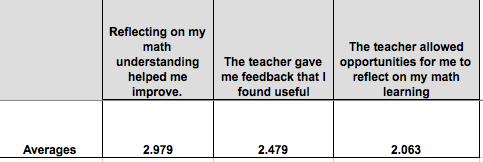
I really like this question.  It’s risky as I don’t want the numbers to be the same, but it’s also beneficial because I truly want to see how students’ perceptions of their own growth have changed.  The first question came up with an average 7.67, which I was pretty pumped about.  Most students that I see perceive math as something positive.  Having that perception helps my purpose and it’s a also a credit to past teachers.  The second question rang up as a 9.15.  This was a helpful validation to show that students perceptions about math can change over time.  It also emphasizes the larger picture that math is more than rote memorization/processes and it surrounds our daily life.  I also wonder whether removing the anonymity portion influencd this score in some way.

Screen Shot 2017-06-10 at 6.35.18 AM

This question made me a little anxious.  I feel like knowing a student and developing a positive rapport is such an important component.  It came in as a 4.13.  While looking over the data I found that students that didn’t perform as well rated this much lower than those that did.  Spending time asking about students’ lives is important. Time is such  valuable commodity in classrooms and ensuring that you know a bit more about students can benefit all involved.

Screen Shot 2017-06-10 at 7.20.19 AM.png

Some students said that I could attend their sporting events or ask about what they did over the summer.  Other students said that I could’ve used a survey at the beginning of the year and not just at the end.  Ideally, it’s probably a decent idea to give a perception survey at the beginning of the year to get to know the students.  I didn’t do that this year, but will most likely put one together for next year.  It’s on the docket.

Screen Shot 2017-06-10 at 6.35.34 AM.png

The responses that I received on the “Anything Else” question surprised me. I’ve never used this before so I wasn’t anticipating results, but I was pleasantly surprised.  About a third of the students mentioned class activities that they enjoyed or told me about how they’ve changed over the school year.  Some students commented about certain math activities that they thought were valuable.  Making it mandatory probably also played a role in why students added more than a “No” to the comment field.  In the future I’ll be adding an “anything else” question to my survey.


Well, now that the school year is over it’s on to planning the next!

Student Surveys and the Reflection Process

Screen Shot 2015-06-12 at 1.59.39 PM

Yesterday was the last day of the school year for my students.  The end of the school year tends to be filled with excitement and pride as students transition from one grade to another. During this time of the year I usually give my students a feedback survey. I tell the classes that I’ll be using the information to change next year’s classes for the better.  I’ve been using this method for the past few years and find it valuable in preparing for the fall.  Most of the questions that I ask tend to stay the same while I add a few others depending on what I’m focusing in on for the year.  This year I asked a few questions related to feedback and student refections.  These particular questions stem from some of the district’s initiatives, as we’re emphasizing Hattie and Dweck’s research.  Next year we will be focusing on them even more and I believe they’ll be part of a formal walk through process.  So I gave the survey to 50 3 – 5th graders and collected the data.  The survey that I used can be accessed here.

I took the 50 students responses and had Excel calculate the averages for all of the questions. Below are few highlights from the feedback and reflection questions.  I used a 1 – 10 rating, with 1 being all the time and 10 being never.

Screen Shot 2015-06-12 at 1.49.33 PM

My takeaways:

I have to keep in mind that elementary students are taking this survey.  It’s valuable, but I feel like a third grader will perceive a question possibly different than a fifth grader.  Regardless, the data is valuable in my mind.  I looked over the numbers and shared this information with another class.  After showing the data we had a great conversation about reflecting on our learning.  Our conversation looked at the connection between allowing reflection opportunities and how they impact our learning.  We started connecting parts of the survey as a cause/effect scenario.  The conversation wasn’t too deep, but worthwhile as students made connections.  We decided that reflecting on our learning can be impactful, but not necessarily help a person understand a particular concept.  Feedback, reflection and opportunities to take action need to all be place. What seemed to be lacking this year were opportunities for students to reflect AND take action based on that reflection.  It’s important to reflect, but without any action or change in perception the act might not be reaching its full potential.  I decided to write an informal flow chart indicating the process that the classes tended to use.

withnotes

I told the students that one of my homework assignments over the summer is to provide ways to make student reflection opportunities more efficient.  This is something I’ll be revisiting in the fall with my new classes.

Using End of Year Classroom Survey Data

Screen Shot 2013-06-04 at 10.19.34 PM

For the past few years I’ve used a student motivation survey with my class.  The survey is used for reflection purposes and to plan for the next school year.  This year approximately 80 students in grades 3 – 5  answered questions related to what helps them learn best.  The statements are below (click picture to enlarge).

n.survey

I usually explain each question to the class and then the students  individually respond as they see fit.    After the results were compiled and averaged (1 being the most important, 10 being the least), I shared the top three motivators.  They are as follows:

  • The teacher shows she/he cares about you and the other students in class – 1.20 / 10
  • The teacher is fair to all students in the classroom – 1.22 / 10
  • The teacher allows you to use technology to learn – 2.02 / 10 

After the results were presented, the class had a discussion regarding why they felt the motivators were especially important.  I also shared that the results were very similar to last year’s results.   One key takeaway was that having a teacher that cared about them was extremely vital in motivating students to learn.  This isn’t surprising, but a passionate teacher can be contagious and elementary students often feed off of that excitement.  Another takeaway, relationships matter in the classroom.  Also, it seems that technology continues to play an increasingly important role in the learning process.

I then presented the bottom three categories.  The bottom three aren’t necessarily negative, but they scored the least important out of all the categories. The class then discussed why they felt like those categories deserved a less than stellar score.

  • The teacher gives choices to complete an assignment – 5.51 / 10
  • The teacher allows you to move around the classroom – 4.43 / 10
  • The teacher gives assignments that connect to the real world – 3.53 / 10

At that point I thought it might be beneficial to bring up the topic of motivation and rewards in the classroom.  This year I decided to eliminate material rewards (pencils, stickers, auctioned prizes, etc.) to reward my elementary students.  It took some research and a bit of teeth grinding, but I went cold turkey with the external rewards this year.  This was a shift from years in the past.  After analyzing the positive results and increase in student ownership, I may do the same next school year.

Utilizing Student Survey Results

 Image by: S. Miles


I’m currently preparing for next school year.   Part of my preparation includes the creation of a student survey.  After reading a post from @TerryFErickson I decided to create a survey (similar to this) for my current students.

I’m planning on using the survey data to make changes for next school year.   I’ve always valued student feedback via plus/delta charts, but this survey is intended to be utilized for next school year.   In order to best meet the needs of my students next year, I wanted to give my current students an opportunity to express their opinions regarding motivation.  I believe that motivation is often affected by the classroom climate.  The process I used for this survey activity is below.

1.)  Students complete the survey.  Here is the beginning of the survey:

2.)  After students complete the survey, I complied the results and displayed the data from different classes. (Click to enlarge)

3.) The class reviewed the data.

Based on this survey, the top three things that motivate my students are:

  • The teacher shows she/he cares about you and the other students in the class
  • The teacher shows that she/he really loves to teach and learn
  • The teacher uses technology when teaching

This activity took two class sessions to complete.  After a rich classroom discussion about the data, students concluded that the main factor that helps motivate them to learn is the teacher.

%d bloggers like this: