Representing Fractions

During the past few weeks my students have been studying fractions. I feel like the class is making a decent amount of progress.  The class has moved from identifying fraction parts to adding the pieces to find sums. Pattern blocks have been especially helpful with adding fractions. I feel like students are becoming more confident with the computation and we haven’t used the word common denominator yet.  I don’t want students to by relying too much on just the algorithm.  Throughout this process I’m noticing that students are struggling with fraction word problems. Students are having trouble identifying what the fractions represent in the problems.

Yesterday we had a class meeting to discuss this topic. This fit in well with a book that I’ve been reading.  Chapter 8 emphasizes how to teach fraction concepts and computation.  The chapter begins with misconceptions and the different meanings associated with fractions. The class reviewed all the different ways that they view fractions. We documented the class ideas on an anchor chart.

Photo Jan 28, 9 17 09 AM

Do you notice any trends? The class looked at the list and had no complaints. This is how they visualize fractions. When asked how they use fractions they came back to this list and didn’t have anything to add.  Keep in mind that this is from a group of third graders.  The next step in the class conversation was to discuss different ways that fractions are represented in problems.

Screen Shot 2016-01-28 at 9.01.22 PM

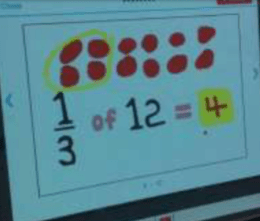
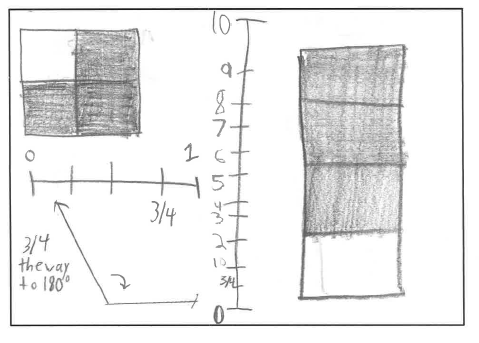
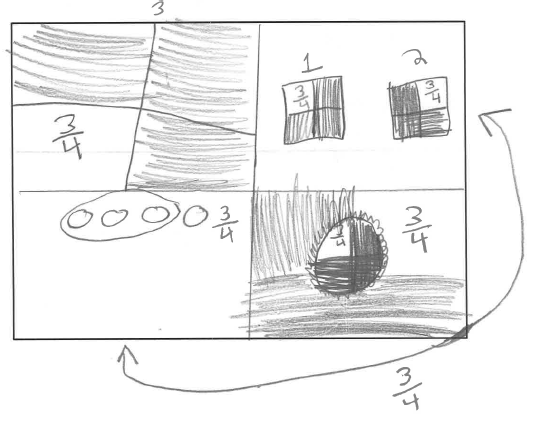
I started with part-to-whole representations. Most kids were familiar with this type of model. After all, students have been using this model for the past week and most of last year. I then moved onto how fractions can be used to measure objects.  Students nodded their heads in agreement and asked questions as I went through the other representations. Connections were made through this process.  Students created examples of each representation in their math journals.

Photo Jan 28, 9 17 29 AM

Students are planning to revisit the word problems that I discussed earlier in this post.  They’ll be reading the question and match the context to the representation.  I’m looking forward to having students use this strategy moving forward.

Visualizing Fractions

Screen Shot 2016-01-23 at 8.42.19 AM.png


My third grade students started a new unit on fractions this week.  They’ve explored fractions before, but more along the lines of identifying different types of fractions and adding/subtracting with common denominators.  This new unit involves students finding fractions of sets and a heavy dose of fraction computation.  Students need to have a deep understanding of fractions to be able to add them and show a visual model.  So on Friday  the class practiced skills associated with finding fractions of sets.  Students were given this prompt:

Draw four different ways to show 3/4 in the box below.

The student models fell into a few different categories.

  • A number line
  • Pie, rectangles, squares
  • Dots or arrays
  • Angles


Screen Shot 2016-01-23 at 8.23.07 AMScreen Shot 2016-01-23 at 8.23.25 AMScreen Shot 2016-01-23 at 8.23.36 AMScreen Shot 2016-01-23 at 8.24.09 AM

The class reviewed the results and we had a discussion about the different ways to represent fractions.  Next week the class will be combining these models to add and subtract mixed numbers.

Coordinate Grids – Part Two

Screen Shot 2016-01-16 at 11.04.49 AM

Last week my students started to plot points on coordinate grids.  They were identifying different quadrants and becoming more confident with drawing shapes on the plane. While reflecting on last week’s activities I noticed a Tweet that was sent our replying to one of my blog posts.

I’m a rookie when it comes to Desmos.  Most of the stories I hear involve middle or high school students. I needed to find something that worked with my elementary kids.  So I started to research and did a little bit of exploring to see how this could be used with my third grade class.  I ended up looking up some of the templates but had a bit of trouble finding an extremely basic rookie-like coordinate plane activity for my students.  I decided to go the route of creating a template and having  students manipulate created points for a project.  Click here for the template.

I quickly found that students had no idea how to use Desmos.  I gave the students 5-10 minutes to orient themselves.  Students were asked to move the points to certain coordinates  on the grid.  As they moved the points students started noticing that the tables on the left side of the screen changed.  Students started connecting how the tables changed and this helped reinforce concepts learned last week.  After this introduction time, students were given a rubric that contained the following:

  • Move the points on the grid to create two angles
  • The angles need be located in two different quadrants
  • The angles need to be acute and obtuse with arcs located in each one
  • Indicate the measurement of each angle

Students were then given 15-20 minutes to create their projects.

Screen Shot 2016-01-16 at 10.37.39 AM

Students created their angles by moving the points around the grid.  Students then shared their projects with the class.

Screen Shot 2016-01-16 at 10.44.32 AM

Students took a screenshot and then added the degree measurements to the angles.  The class reviewed the projects and students explained how they plotted the points.  This project seemed to help students make the connection between points and the x and y-coordinates.  It also reinforced skills related to angle classification and measurements.  I’m looking forward to expanding on this project next week.

Exploring Coordinate Grids

Photo Jan 07, 9 16 05 AM

My third graders started to explore coordinate grids this week. For many, this was the first time that they’ve used them. Some of the students have played Battleship or some other game that involves a grids.  Playing off that background knowledge, I used a road map to show how people can find certain locations by using a coordinate grid. This made sense to some of the students but a few still were unsure of what axis was used first to determine where to plot a point.  This was a reoccurring theme throughout the lesson.

During this process I remembered a strategy that another colleague suggested a few years ago. She borrowed the idea from another teacher and it seemed to work well in her classroom. A colleague of mine used (3,2) as an example of the “go into the building” – first number (right 3) and then “go up or down the elevator” (up 2) method. I decided to use that strategy and a few more students started to grasp the process.  The next activity in the paragraphs below seemed to solidify a better understanding for the rest of the class.

Earlier in the day I created a very short Nearpod lesson involving mostly pictures of coordinate grids. I handed out a iPad to each student. Students logged in and given a picture of a grid and asked to draw and label points.

nwBSug

I then revealed the pictures to the class on the whiteboard. The names of the students were hidden so that we could analyze each response without throwing judgement lightning bolts towards a specific individual. As the class went through each picture they started to notice trends.

Photo Jan 07, 9 20 58 AM

  • Some were switching up the x and y-axis numbers
  • Some were not creating a point
  • Some were not creating a letter for the point
  • Some were confused by the negative sign in front of the numbers

Students observed these issues from the first question and grid. After a decent discussion on the above trends, the class moved towards the second grid and question. I gave the students that same amount of time and the results seemed to initially improve.

Photo Jan 07, 9 26 56 AM

Students started to become better at finding their own mistakes before submitting their creations. I used the same strategy as earlier and displayed the results to the class. There were a few that had some of the same misconceptions, but not as many. In fact, many students vocalized the class improvement since the last question. One of the evident misconceptions revolved around students having trouble plotting negative numbers on the coordinate grid. The class discussed this and completed the third question and grid. The student responses from this question were much better than the prior two. Students were starting to develop some true confidence in being able to correctly plot points on a coordinate grid. I kept a list of the trends that students noticed and will bring it out later in the unit as we’ll be revisiting coordinate grids next week.

Photo Jan 07, 9 25 57 AM

After our Nearpod lesson (which was about 15-20 minutes) students played a Kahoot on identifying points on a coordinate grid. I felt like this was helpful as students identified the points and were able to gauge their own understanding compared to the goal.