I've taught elementary and middle school students for the past 20 years. I enjoy reading educational research and learning from my PLN. Words on this blog are my own.
Over the past few years, my approach to teaching rounding has followed a similar path. The choice of methodology was often influenced by the adopted textbook within a school district. I would generally guide students to place numbers on a number line and determine their proximity to the nearest value. The class would focused on rounding to the nearest tens, gradually progressing to hundreds and eventually expanding to larger place values.
We would introduce a rule that involved underlining the digit to the right of the one being rounded. The rule states that if the underlined digit is “5 or more, round up; if it’s 4 or less, keep it the same.” I believe this has even been turned into a song at some point. This linear progression served as the foundation for teaching rounding at the early elementary level.
This year brought about a change in our district as elementary teachers adopted a new resource. The emphasis shifted to exploring the value of numbers even before delving into the concept of rounding. Students were tasked with identifying the value of specific digits and ordering them, whether from greatest to least or vice versa. We incorporated the use of base-ten blocks and relied on expanded form extensively to help students develop a deeper understanding of number formation and the impact of place value on value itself. Students became more familiar with the value associated with each digit within a four or more digit number.
Students began identifying the closest multiple of a given number. For instance, they would determine the nearest multiple of 10,000 for a number like 432,000. This transition was seamless because students had already explored multiples and factors earlier in the year. Understanding how multiples relate to rounding was a novel approach and it resonated well with the students. Now, when asked to round to a specific digit, students consider the nearest multiple, which seems to make more sense to them. I am excited to continue using a similar rounding teaching strategy moving forward.
Student assesment retakes have been a controversial topic among educators and parents alike. Some argue that giving students the opportunity to retake a test is necessary to ensure that they have mastered the material. This seems to be more prevalent around the circles that embrace standards-based practices. Others believe that it creates an atmosphere where students are not held accountable for their initial performance. I have seen first-hand how the idea of a retake plays a role in how students approach a test knowing they have a second attempt if the first goes awry.
There are several questions that must be addressed when considering implemeting as assessment retake policy. Where should students retake the test? Some schools may have designated retake days or a flex time, while others may allow students to retake the test during a designated study hall or after school. If it is after/before school, tranportation considerations need to be taken in to account. This can be an issue with invidividual teachers if no time exists for the retake. I know of some schools that build this “flex” time in to their master schedules while other schools leave it up to the teacher to decide if it happens.
Another important factor to consider is how much practice students should have before taking the retake. It is important to ensure that students have a thorough understanding of the material before retaking the test. This may involve additional practice materials or targeted review sessions with a teacher or someone else.
Additionally, it is important to determine how long the period should be between the initial assessment and the retake. Some schools may require a certain amount of time to pass before allowing students to retake the test, while others may allow students to retake the test immediately after receiving their initial grade. My thinking is that a certain amount of time is needed for error analysis and practice to occur before another attempt. Missing classtime for the retake can cause issues down the road.
Leaders should consider whether the retake policy should be implemented school-wide or on a classroom-by-classroom basis. Some schools may choose to have a consistent retake policy across all subjects and grades. Other districts or schools may leave it up to individual teachers to decide whether to allow retakes.
I believe the goal of any retake policy should be to promote student learning and achievement. I wrote about this same topic a few years back and am still refining my thiking on how to make retakes more effective.
I believe that it is important for students to perceive math beyond mere digits on a page. Math is often seen as a subject that requires excessive computation, but it encompasses spatial reasoning and artistic aspects as well. Recently, I conducted a class where I blended the skill of multiplying unit fractions with creating a math mosaic and it turned out to be an enriching experience for the students.
To introduce the task, I collected different colored poster paper, glue sticks, scissors, and pencils. I divided the students into random groups and asked them to select an image that was traced onto the larger poster. The teams then decided on the colors and the quantity of each color required to complete the entire mosaic. Students estimated the amount needed and then used 1-2″ strips to find the exact amount. The gluing part of the project was the most time-consuming and required precision.
I was impressed by the critical thinking displayed by the students as they worked on the project. They were meticulous in their approach and made necessary edits to ensure that their work looked aesthetically pleasing. Most groups had to revise their total area numbers as well as number models. Additionally, the groups had to determine which medium to use to create their project, such as stone, tile, or glass. They calculated the entire amount required and added it to their total.
Once the project was completed, the class had a gallery walk where they examined all the creations. This project proved to be an excellent opportunity for students to practice their fraction multiplication skills while infusing an artistic element.
If you’re interested in exploring this specific project further, you can find detailed instructions by clicking here.
The first four school days of 2023 are officially in the books. This school year students and teachers had about 2 1/2 weeks off from school. Teachers came back for an institute day on Monday, and students returned on Tuesday. I find that every year, the transition from winter break back to a regular school routine can be rough. Students and teachers alike make a hard stop and transition back to commuting, eating at certain times, sustaining attention for a certain amount of time, and remembering expectations, etc. Having an institute day on Monday before the students arrived back was helpful in preparing to gradually move students back into school mode. The planning of the first few days reminded me of the first few days of school. They are actually similar in acclimating students to a routine, building a classroom community, and putting together expectations. I made an extended effort to build these in place as students entered the building on Tuesday. This post is primarily used to remind myself of what to do next school year and to share what seemed to work/didn’t work.
On Tuesday studetns came back and I gave time for them to discuss their break with their peers. Most of the students did not have a chance to talk with each other over break so this was a time to reconnect. After that students worked on filling out a 2023 reflection sheet that was created by @druinok.
Students had no problem coming up with 2 good things that happened in 2022 and 2 things that they were looking forward to in 2023. They had a bit of trouble with something to stop and the three goals. The class brainstormed a few ideas about what to stop and a common theme was procrastinating and having a positive attitude. Students then took the sheet and made a few edits after thinking it over. I mentioned that we will be revisiting this later in the school year.
After completing the sheet students added their responses to a Desmos deck that had similar questions. Students logged in using their Google credentials so I could provide feedback.
Students filled out the deck and confirmed their selection on slide seven. Later that evening I went into each submission and wrote a few comments.
One was related to what they did over break and the other was about their goal(s). Students reviewed the feedback the next day. I need to remind myself to do this next year as most students enjoyed this time and I was able to reconnect with them individually.
The second activity involved teams and involved blending math, puzzles and teamwork. Fortunately over break I found a terrific 2023 puzzle by @mathequalslove. I printed out the puzzle at home and tried it out. The “easy” puzzle was a perfect fit for my class as the pieces went horizontal and vertical. Students were randomly placed in groups and assigned the task of putting together the puzzle. I mentioned that the pieces could go horizontal or vertical. I didn’t realize that (or didn’t read it carefully enough) when I put it together at home and had to reach out to Sarah to find a solution. Some students had a challenging time putting together the puzzle. I had a few groups that thought it was impossible, but then they prevailed. Students cut out the final product, put a few designs on it and I put it on the wall. My hope is that when students see the wall it will bring back positive memories of persevering and working through a challenge.
The third task to help with the transition involved order of operations and collaboration. I have to give props to @seewins for putting together the 2023 year game challenge. I alwsy look forward to this amazing resource as Craig as been creating them for years.
Students worked in stations to find as many solutions as possible. The class worked on this for around 20 minutes and there were cheers when the class found a solution – talk about teamwork! I left the task open this week and some students even got their sibilings involved. One kid with the help of an older sibling was able to get 100.
On Friday students finished off the week by reflecting on the last four days. They reviewed their goal sheets and filled out a simple deck on how they were feeling.
The results indicated that many students were in the easy or not there yet. Only a few indicated that it was really tough. I believe we are making progress, but not fully in a routine yet. I feel like using activities like these mentioned inthe post has helped make the transition a bit easier and I will most likely use someting similar after long breaks moving forward.
As 2022 ends I’m starting to think about next year. I’m now in the middle of a school break and reflecting on the progress that was made this past year. I’ve had some time to think about the last few weeks of school and what will come in January.
Before break my fifth grade students finished a unit on decimal multiplication and division. During the first three assessments I kept on finding that students made simple mistakes or didn’t completely answer questions before turning in the test. I feel like part of that is due to the increased staminia needed as we traversed from remote to hybird and eventually to in-person learning. The simple mistakes or incomplete work pieces were overlooked and impacted their marks – especially related to written mathematical responses.
To address this I decided to created a test checklist. The checklist included a line and a task. For example, __ I made an estimate before using an algorithm. The sheet was about 4″ x 4″ and printed out on colorful paper. All students filled out the sheet and checked-off each line before stapling it to the front of the test. I’d say most followed-through on checking and it reminded students to check their work in the process.
After the assessment I had students self-reflect on their performance. Students completed a Desmos task and here is the deck.
Students then checked-off correct vs incorrect answers. Students saw a list of concepts that might need bolstering and strength areas based on thier initial responses.
Students spent a good deal of time on this particular slide. They had to made a judgement call regarding where they were compared to the standard. Some students felt like they should’ve been placed in a different category because of a simple mistake. The next slide added an opportunity for students to provide context for their analysis or ask questions.
For the most part students found the process useful. I’m looking forward to using a similar self-reflection process for the next unit assessment.
Hey, it’s been a minute and I’m back to blog writing. Feels good to get back to writing amid the turmoil that’s happening on the bird app. So here we go!
We’re in the middle of November which marks about a third of the school year. Parent/teacher conferences are right around the corner and Thanksgiving Break is looking appetizing right now. I actually look forward to conferences as I get to connect with parents and discuss progress that’s been made and areas where improvement is warranted. Having conversations with parents bring awareness and is helpful, but seeing changes in the classroom takes a supportive team and includes everyone – including the student. One of the better ways that I’ve observed in helping students become aware of areas that need improvement is through self-reflection. I find students react better and take actions when they make their own conclusions/connections comparing their performance to a criteria.
With that in mind I had students think about the math units that we’ve explored by reviewing unit assessments, notes, journal pages and Canvas submissions. They reflected on their progress and made a determination.
The goal is on the left and students picked one of the three categories. It was up to the student to decide on a category. Students also had to complete some error analysis to come of a conclusion whether a mistake made on a quiz or test was something simple or a deeper issue. I was pleasantly surprised to see that most students were taking a decent chuck of time to make a decision on the category.
The reflection sheet continued with goals related to study habits. The criteria changes for this section to improvement vs being satisfied.
Homework completion has been an issue this year so that was part of the sheet this time around. I also wanted to encourage students to compare their efforts and results – hoping that the connection between the two become more apparent. Students again spent time analyzing their performance and filled out the boxes accordingly. It took students around 10-20 minutes to complete each sheet.
I collected the completed sheets from students in grades 3-5 and also communicated again that they’ll be used during parent/teacher conferences. I had one set of conferences about a week ago and another set will be coming up soon. My plan is to revisit the reflection sheet during the second trimester and have students look at the growth over time.
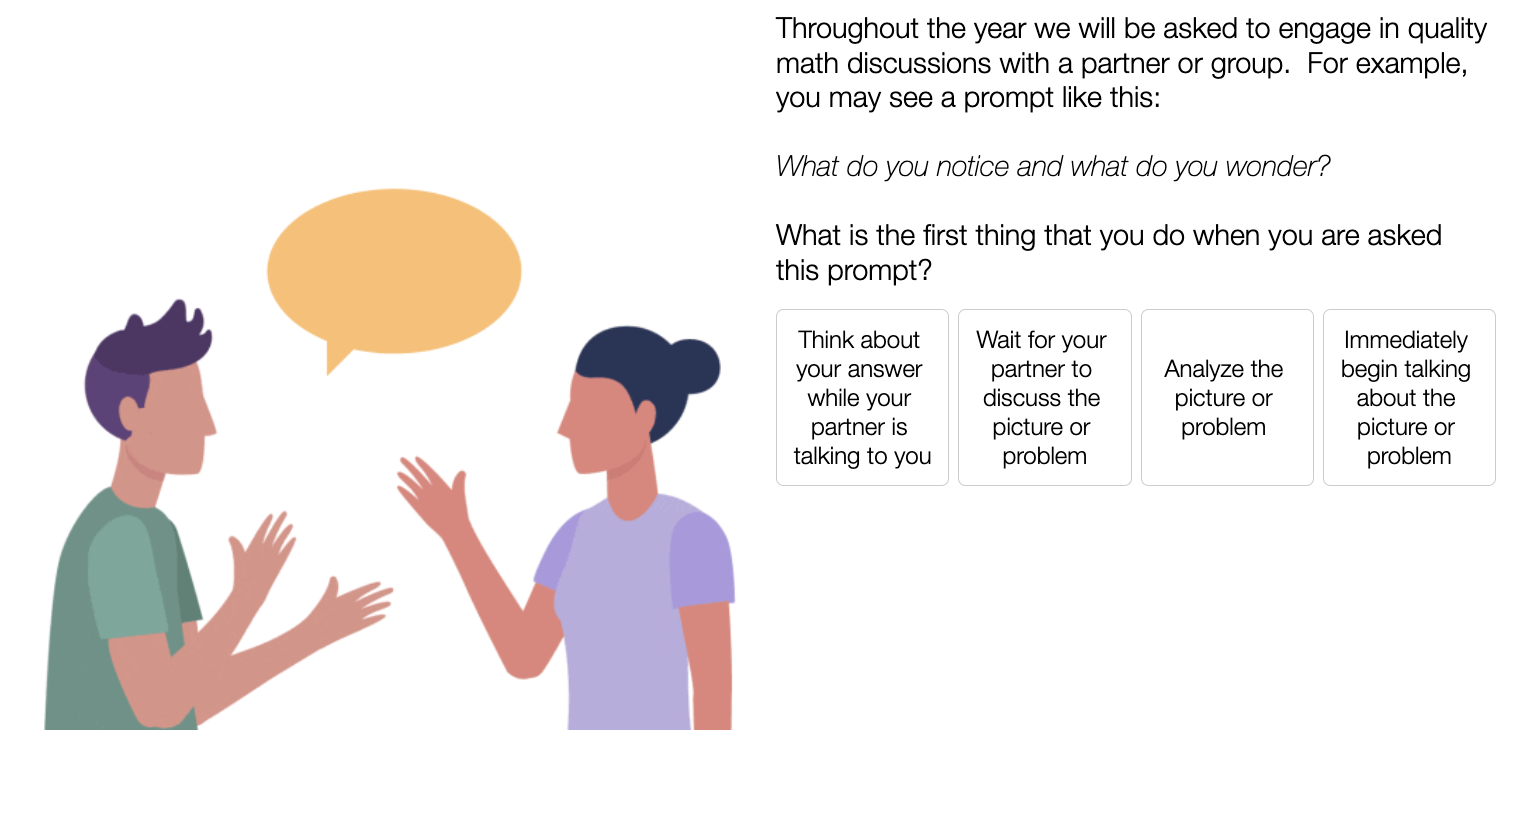
This year my district decided to switch to a new math resource. After using Origo for more than a decade we are now using Illustrative Mathematics. Besides the change in materials, teachers have had to navigate a new platform and instructional approaches that are significantly different compared to the last adopted resource. This change in expectations has been a challenge. The shift in a different math instruction approach was discussed during curriculum night earlier in the year. One of the larger foundational shifts involves the increased amount of math discussions that are expected to occur throughout a lesson. This year students are asked to engage in quality math discussions at least a few times every lesson. There are many “what do you notice, what do you wonder”type of prompts as well as others. The conversations are usually around 3-5 minutes and then students share their discussions with the whole class.
Along with other teachers, I observed that the math conversation opportunities were far from perfect. Some groups had one particular student that spoke for the entire time. Other groups didn’t stick to the prompt or jumped into the conversation before the partner was ready to discuss. After reflecting a bit I felt that students needed a routine for math discussions. That structure, just like many of the routines at the beginning of the year, would hopefully pay dividends as the year progressed. My goal was and still is to improve the quality of the math discussions happening in the classroom. I re-read this book to get a few ideas bout the process. Then I started to build a Desmos deck to help communicate the process that the classes were going to use moving forward.
The deck started off by asking students about past math conversations.
Students picked an option and we discussed it as a class. The consensus was that the class should analyze the picture or problem first. That led to the next slide related to what happens after we analyze the prompt.
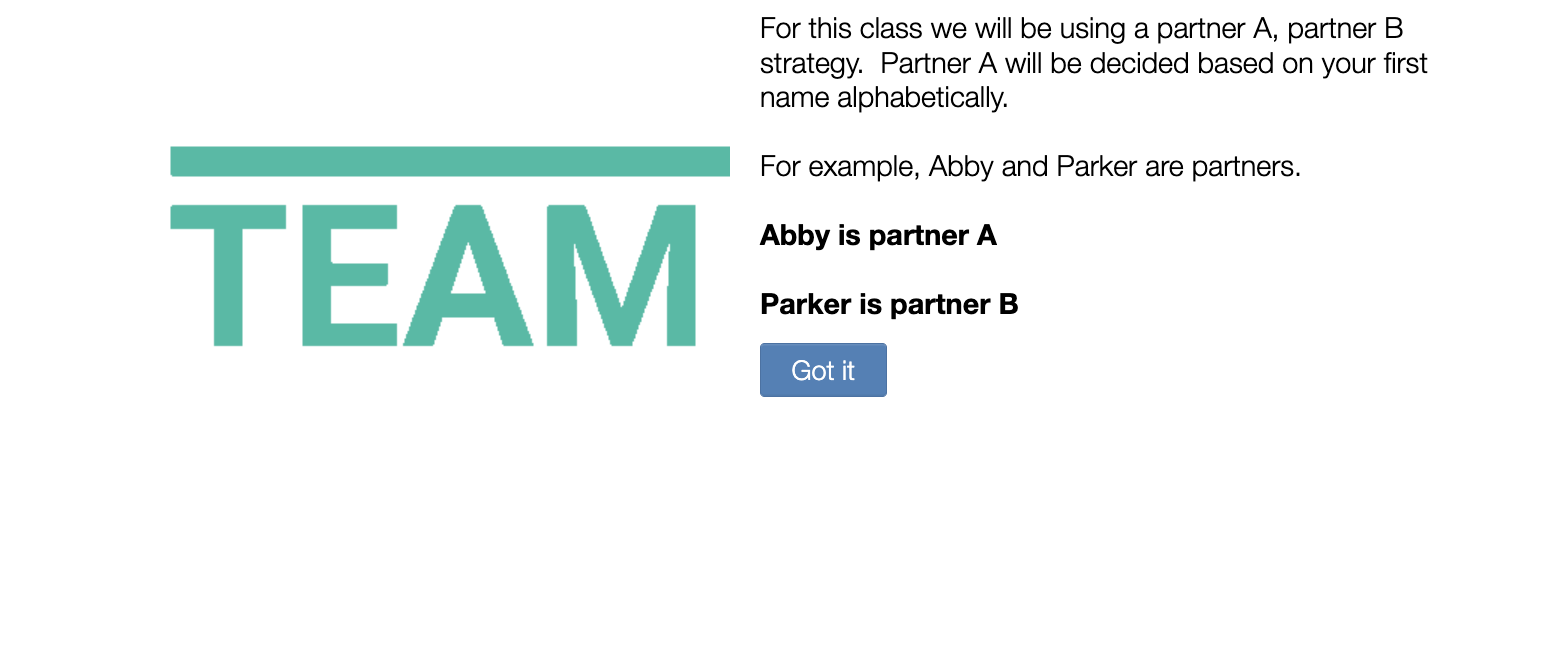
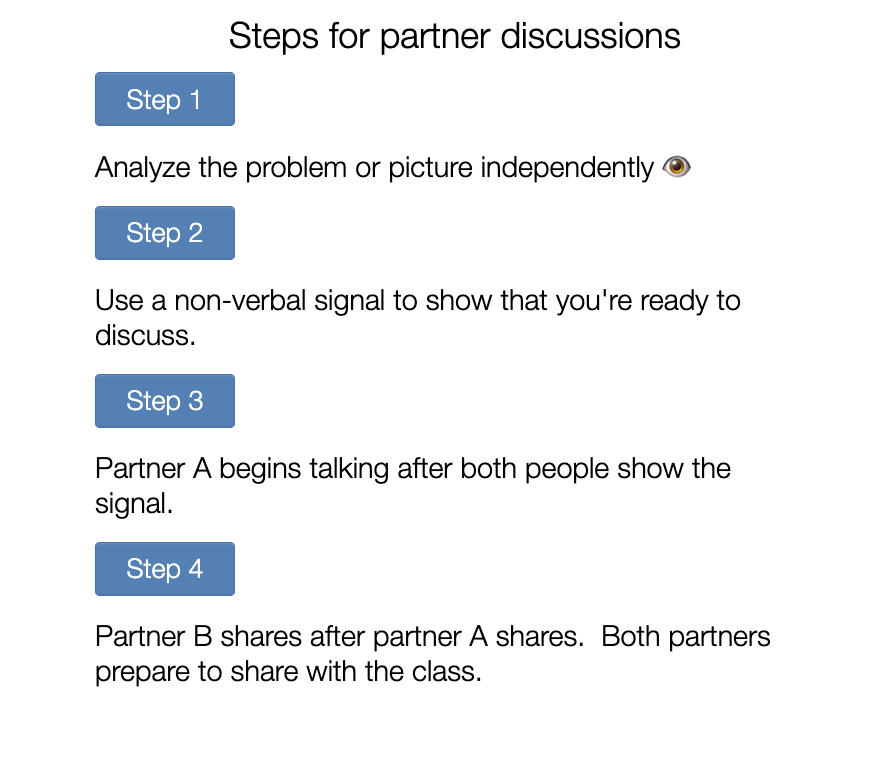
Moving on the next slide gets the students talking about the process after analysis. Students will give a non-verbal signal showing that they’re reading to discuss. The class had a fun time creating their non-verbal signals, although I had to repeat more than once to make sure they were appropriate (ah fifth graders!). As students progressed through the deck we reviewed who should go first in the group and why.
We went with the alphabetical approach since the groups will change throughout the year. The class also discussed how to non-verbally show that you agree with the statement from your partner to make sure the conversation continues without interruption. We also discussed sentence stems that can be used to help start the conversation.
The next few slides reviewed the process discussed earlier in the deck.
The class went through a review of the process and tried out a practice round with their current partner. The entire class deck took about 25-30 minutes including the practice round. Feel free to use the Desmos activity by clicking here. The class completed this activity on Tuesday and we used the process daily since then. So far I’m seeing positive results and better quality math conversations. Of course there are hiccups, such as students still using more time than anticipated and/or students finishing too early, but I’m glad to see the conversations moving in the right direction. Later in the week the classes reinforced the math conversations procedure with this quiz.
I’m curious to see what others use to emphasis quality math conversations in the classroom.
School is open! The first week of the 22-23 school is in the books. It has actually been four days but l will round up because it felt like more than a week. It has been a whirlwind of a first few days as students headed back to school and are starting to settle into new routines. Teachers are doing the same and navigating new instructional resources. This is the first time in three years that we have had a somewhat normal of a start and the overall excitement being seen around the school is telling.
I find that students are excited and at the same time anxious to be back in school to see their friends and begin a new journey. Class discussions about community, expectations, routines, and drills flooded the halls this week. Clubs and sports are in session and the usual community builders are back in action. This year has been a bit different as there is a higher than usual emphasis on social and emotional learning as well as drills regarding safety. Beginning of the year professional development was geared towards bringing awareness to the need for students to feel like they belong. Staff kept this in mind when thinking about community builders early this week. The list below includes a few items that were used during the first four days.
Sara’s name tents. I missed a couple days and will need to make them up next week. I continue to be amazed with how receptive students are to the correspondence and it is a great way to build rapport.
Class puzzle. Each student receives the same piece (about 6″ x 6″ that includes information about likes and dislikes. It also allows for an opportunity for students to use art tools to create a background image. The pieces fit together to make the class. I usually hand this up on the door for the year since each piece tessellates.
Getting to Know You Quiz. Students give the teacher a two question multiple choice quiz. The students get a kick out of creating a couple questions for the teacher to complete. Even more, they find joy in becoming the teacher and grading the teacher’s response.
Along with the feeling of community I ended up getting a couple items in the classroom that are geared towards make a positive difference. These items are intended to help to contribute to the environment throughout the year.
Paper roller coaster. This is a yearly hit with the kids and without social distancing guidelines there will be more collaboration involved with the builds. I wrote about this in the past and am looking forward to using it with my 3rd and 4th grade crew over the coming months.
Kolam tiles. I am always game for math puzzles and games and this seems like a winner. I usually include a math station for students that displays different math puzzles. The Kolam tiles are unique to the classroom and will be a great addition.
Light covers. I have heard parents, students and staff discuss the impact of bright florescent lights in the classroom. Being under the lights for a prolonged period of time has caused me headaches before and this will give a different vibe to the classroom setting. I have already had a few students mention how they like it. My classroom is on the second floor this year so I refer to them as skylights.
I hope all of those in the classroom are off to a great 22-23 school year!
I hear from time to time that things in education are difficult to change or the status-quo goes. It is possible to make a shift but that takes time, leadership and often a large amount of support. One thing that has changed quickly is the amount of teacher movement this summer. The sheer amount of teacher and admin position movement this summer is on the rise and I do not think we have seen the end of it. Political and systematic issues have created a challenging atmosphere in schools. More than a few teachers that I have interacted with over the past decade have moved to different positions and/or have switched careers altogether. While I am sad to see them go I am also excited for the new adventures that await them.
Now here is the situation. I am assuming that there will be many new faces in teachers’ lounges across the nation – recent hires and transitioning teachers. More so now than in most year. How will established school communities embrace these new employees? I truly believe having a staff with diverse backgrounds benefits a school district. The new hires have strengths and talents that should be highlighted. I wonder what will be in place to encourage new staff to feel empowered to bring their ideas to the table? What supports exists to sustain and retain teachers for the 22-23 school year?
I do not have clear answers to these questions, but it is worth digging deep to find solutions to make teaching a more sustainable profession. Optimistically, I would like to see the education transitioning tides change and to be able to look back and remember the 22-23 school year as one of the better ones in recent memory.
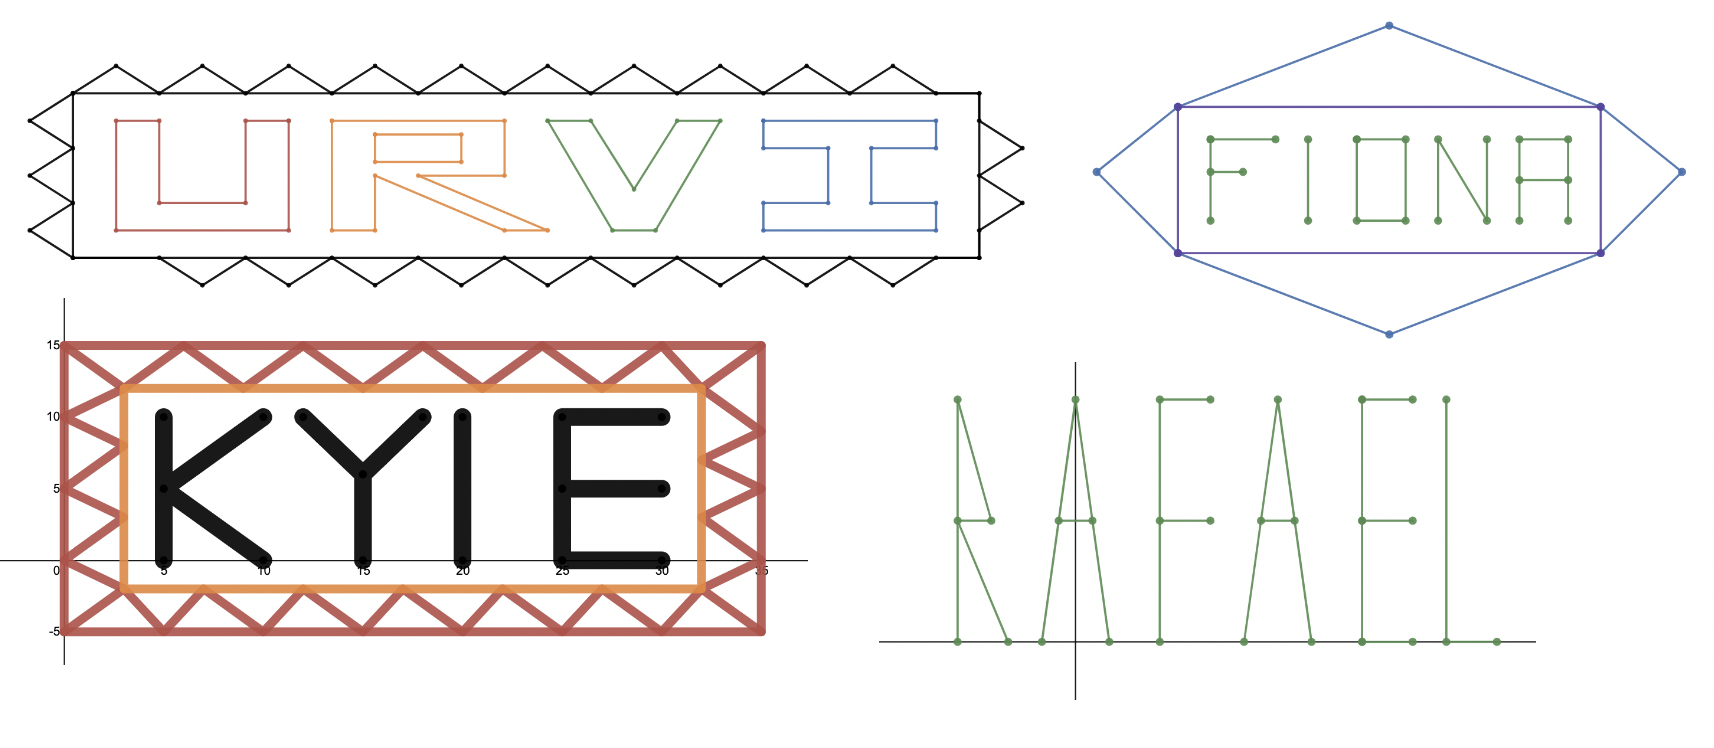
It is official. The 21-22 school year is in the books. It was a year like no other as teachers navigated remote, hybrid and in-person learning throughout the school year. One of the last projects of the year involved a first name coordinate grid task. During the last week of school my class explored coordinate grids and plotting points. Students found the midpoints of lines and solved problems involving scale models on coordinate grids. I thought this task might be a way to help reinforce coordinate points and quadrants. In addition, it was great to have students encounter math in a unique way. Kudos goes to Cathy for sharing the deck which helps guide students through a learning process of graphing points on a grid.
The instructions were key for students as they built confidence before starting the final project. Some students decided to use scratch paper and create their name there first as a draft. Other students dove right in and started the creation process. Students were given about 30 minutes to work on the project and they were asked to submit it to Canvas once finished. About half of the class finished within that time. During the next class the projects were shared and students explained how they made the different shapes and borders using tables.
I was impressed with the time many of the students put in to make this project a reality. During the last day of school I handed each student their printed out copy of the project. I am hoping they brought it home and it is something that brings back a positive math experience memory. Looking forward, I am planning on doing this math and art combination activity next school year.