The first four school days of 2023 are officially in the books. This school year students and teachers had about 2 1/2 weeks off from school. Teachers came back for an institute day on Monday, and students returned on Tuesday. I find that every year, the transition from winter break back to a regular school routine can be rough. Students and teachers alike make a hard stop and transition back to commuting, eating at certain times, sustaining attention for a certain amount of time, and remembering expectations, etc. Having an institute day on Monday before the students arrived back was helpful in preparing to gradually move students back into school mode. The planning of the first few days reminded me of the first few days of school. They are actually similar in acclimating students to a routine, building a classroom community, and putting together expectations. I made an extended effort to build these in place as students entered the building on Tuesday. This post is primarily used to remind myself of what to do next school year and to share what seemed to work/didn’t work.
On Tuesday studetns came back and I gave time for them to discuss their break with their peers. Most of the students did not have a chance to talk with each other over break so this was a time to reconnect. After that students worked on filling out a 2023 reflection sheet that was created by @druinok.

Students had no problem coming up with 2 good things that happened in 2022 and 2 things that they were looking forward to in 2023. They had a bit of trouble with something to stop and the three goals. The class brainstormed a few ideas about what to stop and a common theme was procrastinating and having a positive attitude. Students then took the sheet and made a few edits after thinking it over. I mentioned that we will be revisiting this later in the school year.
After completing the sheet students added their responses to a Desmos deck that had similar questions. Students logged in using their Google credentials so I could provide feedback.

Students filled out the deck and confirmed their selection on slide seven. Later that evening I went into each submission and wrote a few comments.

One was related to what they did over break and the other was about their goal(s). Students reviewed the feedback the next day. I need to remind myself to do this next year as most students enjoyed this time and I was able to reconnect with them individually.
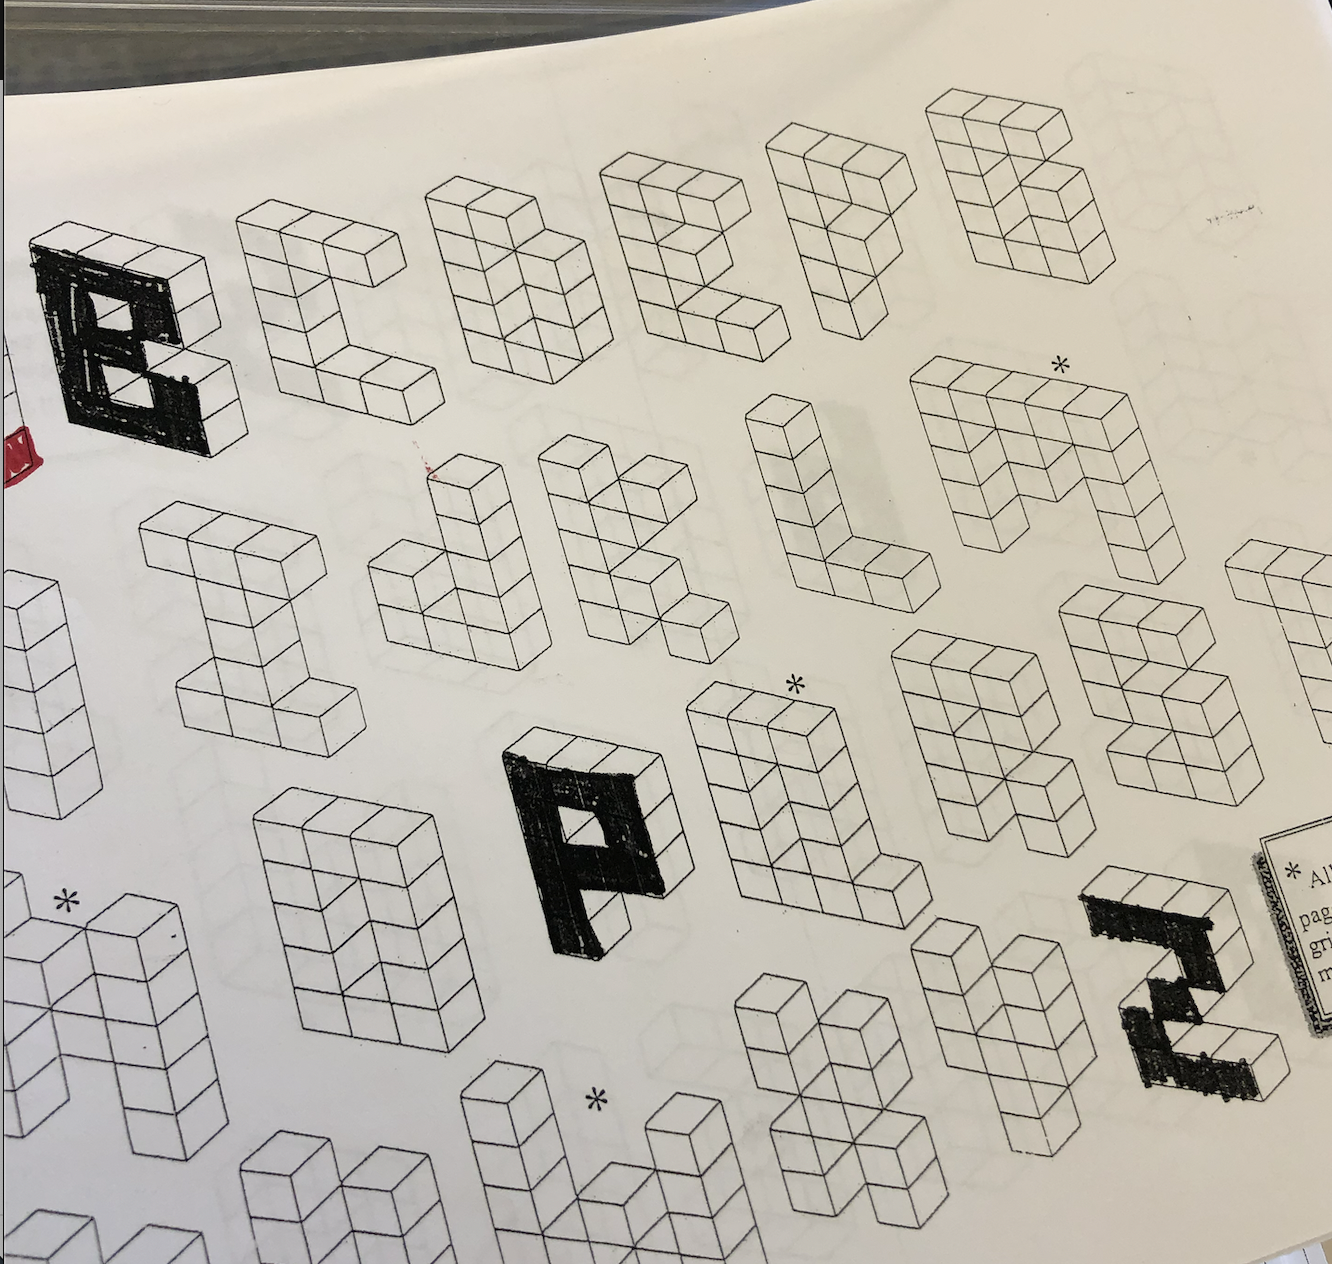
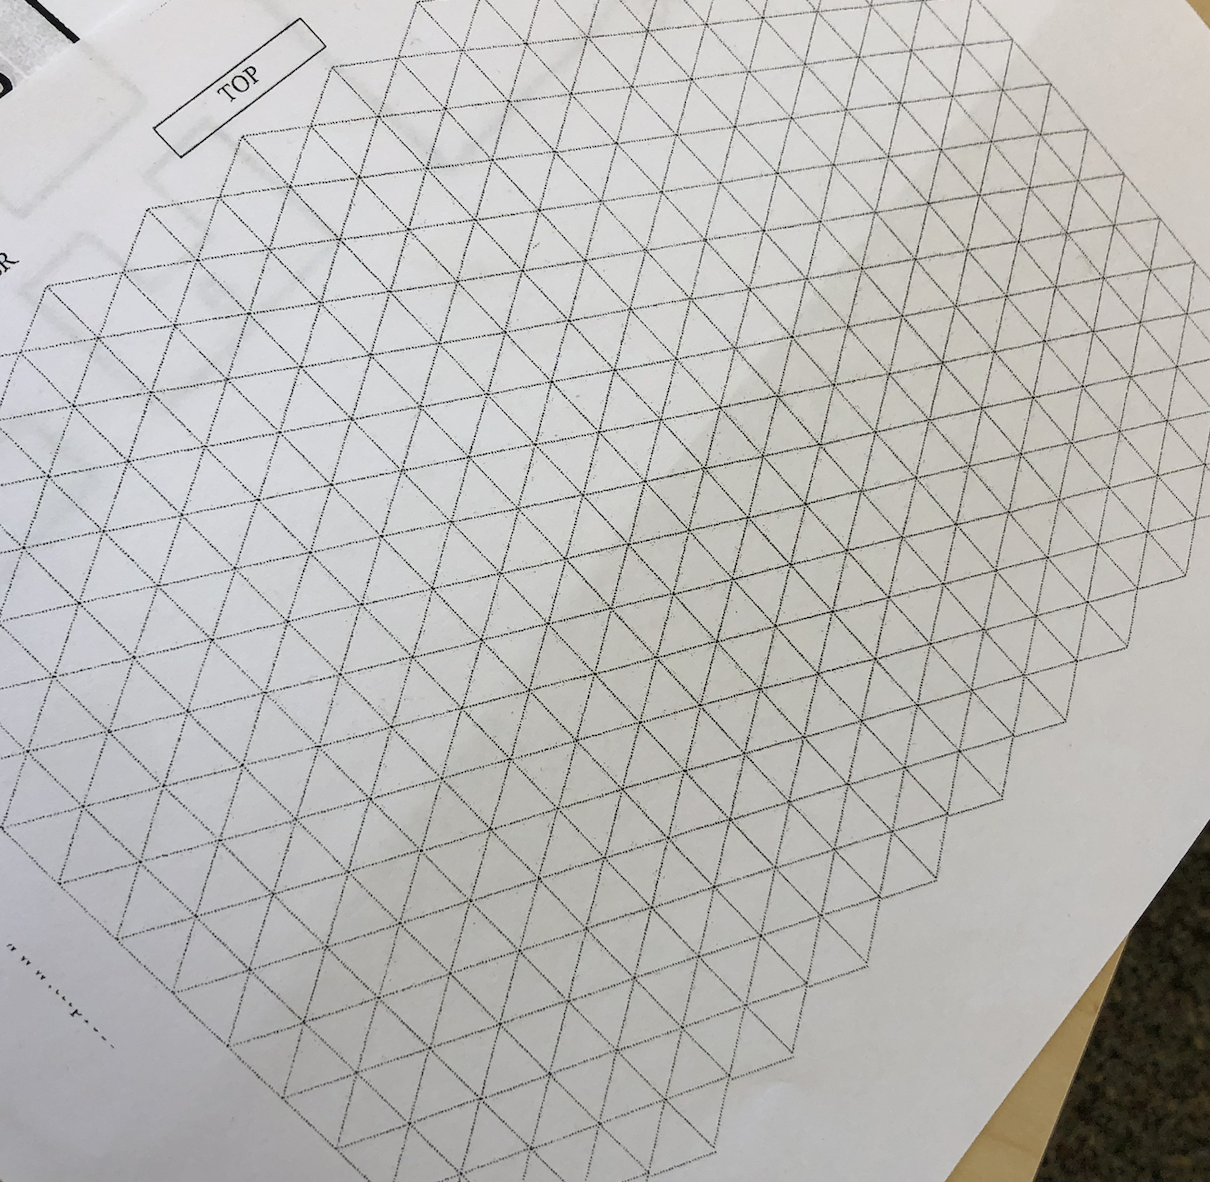
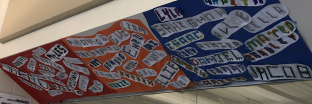
The second activity involved teams and involved blending math, puzzles and teamwork. Fortunately over break I found a terrific 2023 puzzle by @mathequalslove. I printed out the puzzle at home and tried it out. The “easy” puzzle was a perfect fit for my class as the pieces went horizontal and vertical. Students were randomly placed in groups and assigned the task of putting together the puzzle. I mentioned that the pieces could go horizontal or vertical. I didn’t realize that (or didn’t read it carefully enough) when I put it together at home and had to reach out to Sarah to find a solution. Some students had a challenging time putting together the puzzle. I had a few groups that thought it was impossible, but then they prevailed. Students cut out the final product, put a few designs on it and I put it on the wall. My hope is that when students see the wall it will bring back positive memories of persevering and working through a challenge.

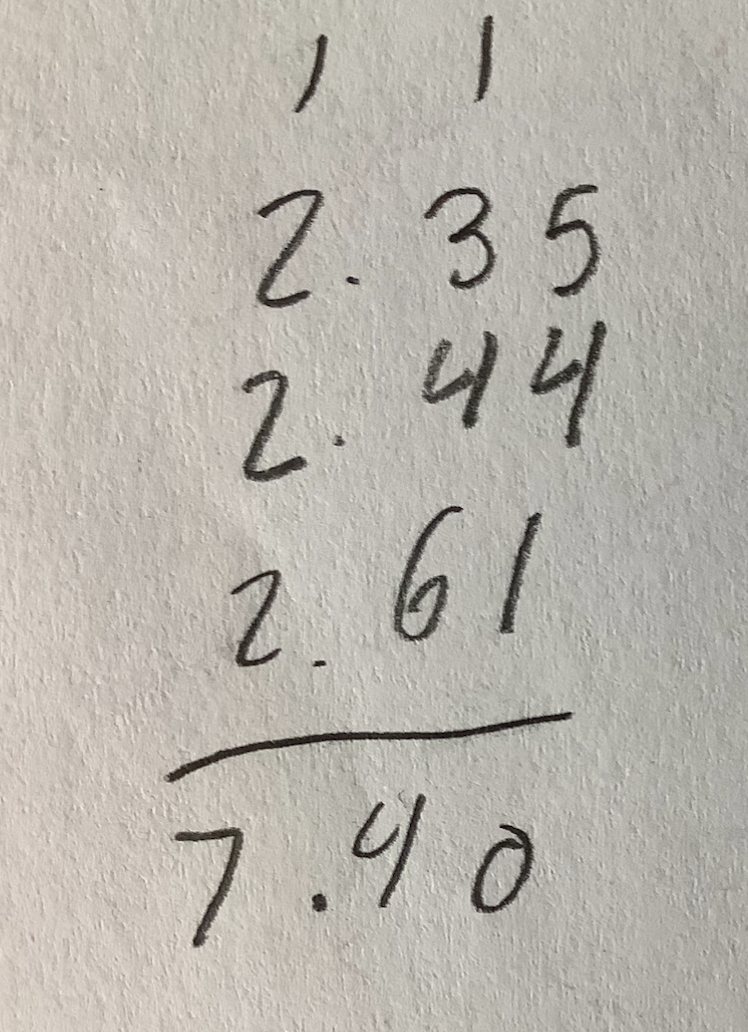
The third task to help with the transition involved order of operations and collaboration. I have to give props to @seewins for putting together the 2023 year game challenge. I alwsy look forward to this amazing resource as Craig as been creating them for years.

Students worked in stations to find as many solutions as possible. The class worked on this for around 20 minutes and there were cheers when the class found a solution – talk about teamwork! I left the task open this week and some students even got their sibilings involved. One kid with the help of an older sibling was able to get 100.
On Friday students finished off the week by reflecting on the last four days. They reviewed their goal sheets and filled out a simple deck on how they were feeling.

The results indicated that many students were in the easy or not there yet. Only a few indicated that it was really tough. I believe we are making progress, but not fully in a routine yet. I feel like using activities like these mentioned inthe post has helped make the transition a bit easier and I will most likely use someting similar after long breaks moving forward.