Over the past year I’ve had opportunities to read books related to math instruction. I volunatarily chose to read these books. They weren’t part of a college class or assigned by my school. Some of the books I found via Twitter while others were recommended by colleagues in my PLN. Two books in particular have impacted my teaching practice this school year. Both books were used in a math book study conducted through Google Hangouts. Anthony helped lead and encouraged others to join these particular studies. The discussions that happen during these books studies are valuable. Through this post I’m going to highlight two books in that’ve helped influence my planning this school year. I believe that the planning has helped produce better instruction and learning experiences for my students.
Teaching Student-Centered Mathematics
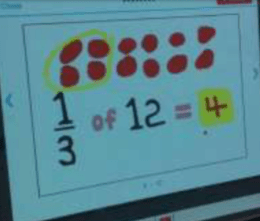
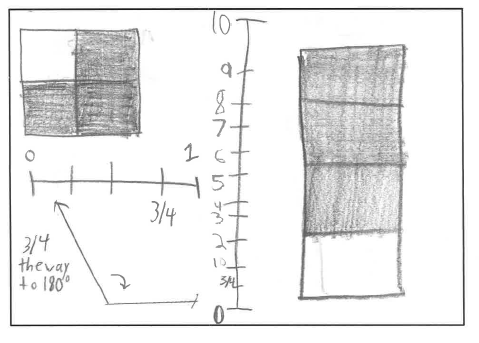
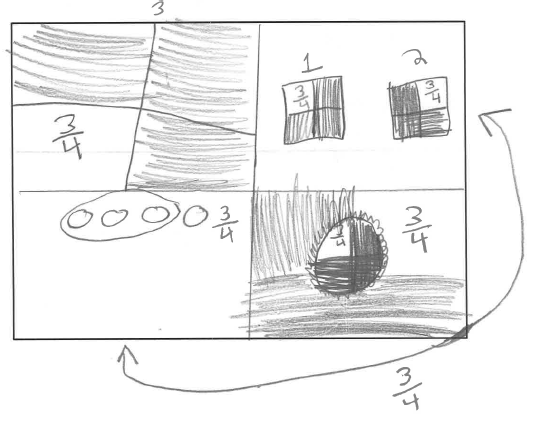
I’ll admit that I’m not completely finished with this book. I’m going to recommend it anyways. What I’ve covered so far has been directly applicable to what I’m teaching. The book was recommended to me by a multitude of math coaches and teachers. Their positive experiences helped egg-on my purchase once I heard that this book was going to be used for a book study. So I took a leap, purchased and have been slowly reading it over the past two months. Nuggets of greatness exist inside this book related to instructional design and how to promote student math understanding. The first few chapters emphasize the reasons to differentiate, assess, and how to work with parents. Part II is where I’m finding the most value. The authors’ take apart different math strands and explicitly show a variety of strategies to introduce or engage students in the learning process. A heavy emphasis on using visual models and building a concrete understanding of mathematics is demonstrated throughout the book. I appreciate the examples of the visual models and practical examples. Some of them were brand new to me. As I progress through the book I’m finding useful strategies to have students think more critically about math tasks. This is taking more time in class but I feel like it’s worthwhile. I’ve used the chapter on fractions more prevalently than others.
How the Brain Learns Mathematics
This was another book that was used for a book study. I skimmed through the first few chapters and found I needed to delve in deeper to get substance. I had to re-read many parts because of the content related to brain science. Most of the information related to neurons and retention fascinated me. These were highlight-worthy for me. I thought much of this should have been introduced during my undergraduate studies. The information about how science relates to math instruction helped me see the connections between how students process numbers and what’s developmentally appropriate for students. There were quite a few affirmation opportunities as well as times where I questioned what I’m doing. I love a book that makes me ask better questions. One of the take-aways that I found helpful was related to how I organize my lessons and that timing plays a pivotal role in retention. All the time involved in math instruction is precious. With that being said, the “prime” time minutes (first 10-15) and (last 10) are very important in how students remember their math experiences. After reading this I started to analyze how I structure my 60 minutes with students. I became more aware of the use of the first and last minutes of class. Another piece that I came away with dealt with the time needed for students to process information. Students need time to process, reflect and create connections about the math concepts that they’re experiencing. I don’t necessarily think that happens as much as I’d like.
Looking forward, I’m hoping to carve out some time to read a couple new books on my shelf. As I’m writing this I have Number Talks waiting for me. At some point I’m going to crack these open and look for ways to improve my own practice.